Back chapter figures
Figure 4.34
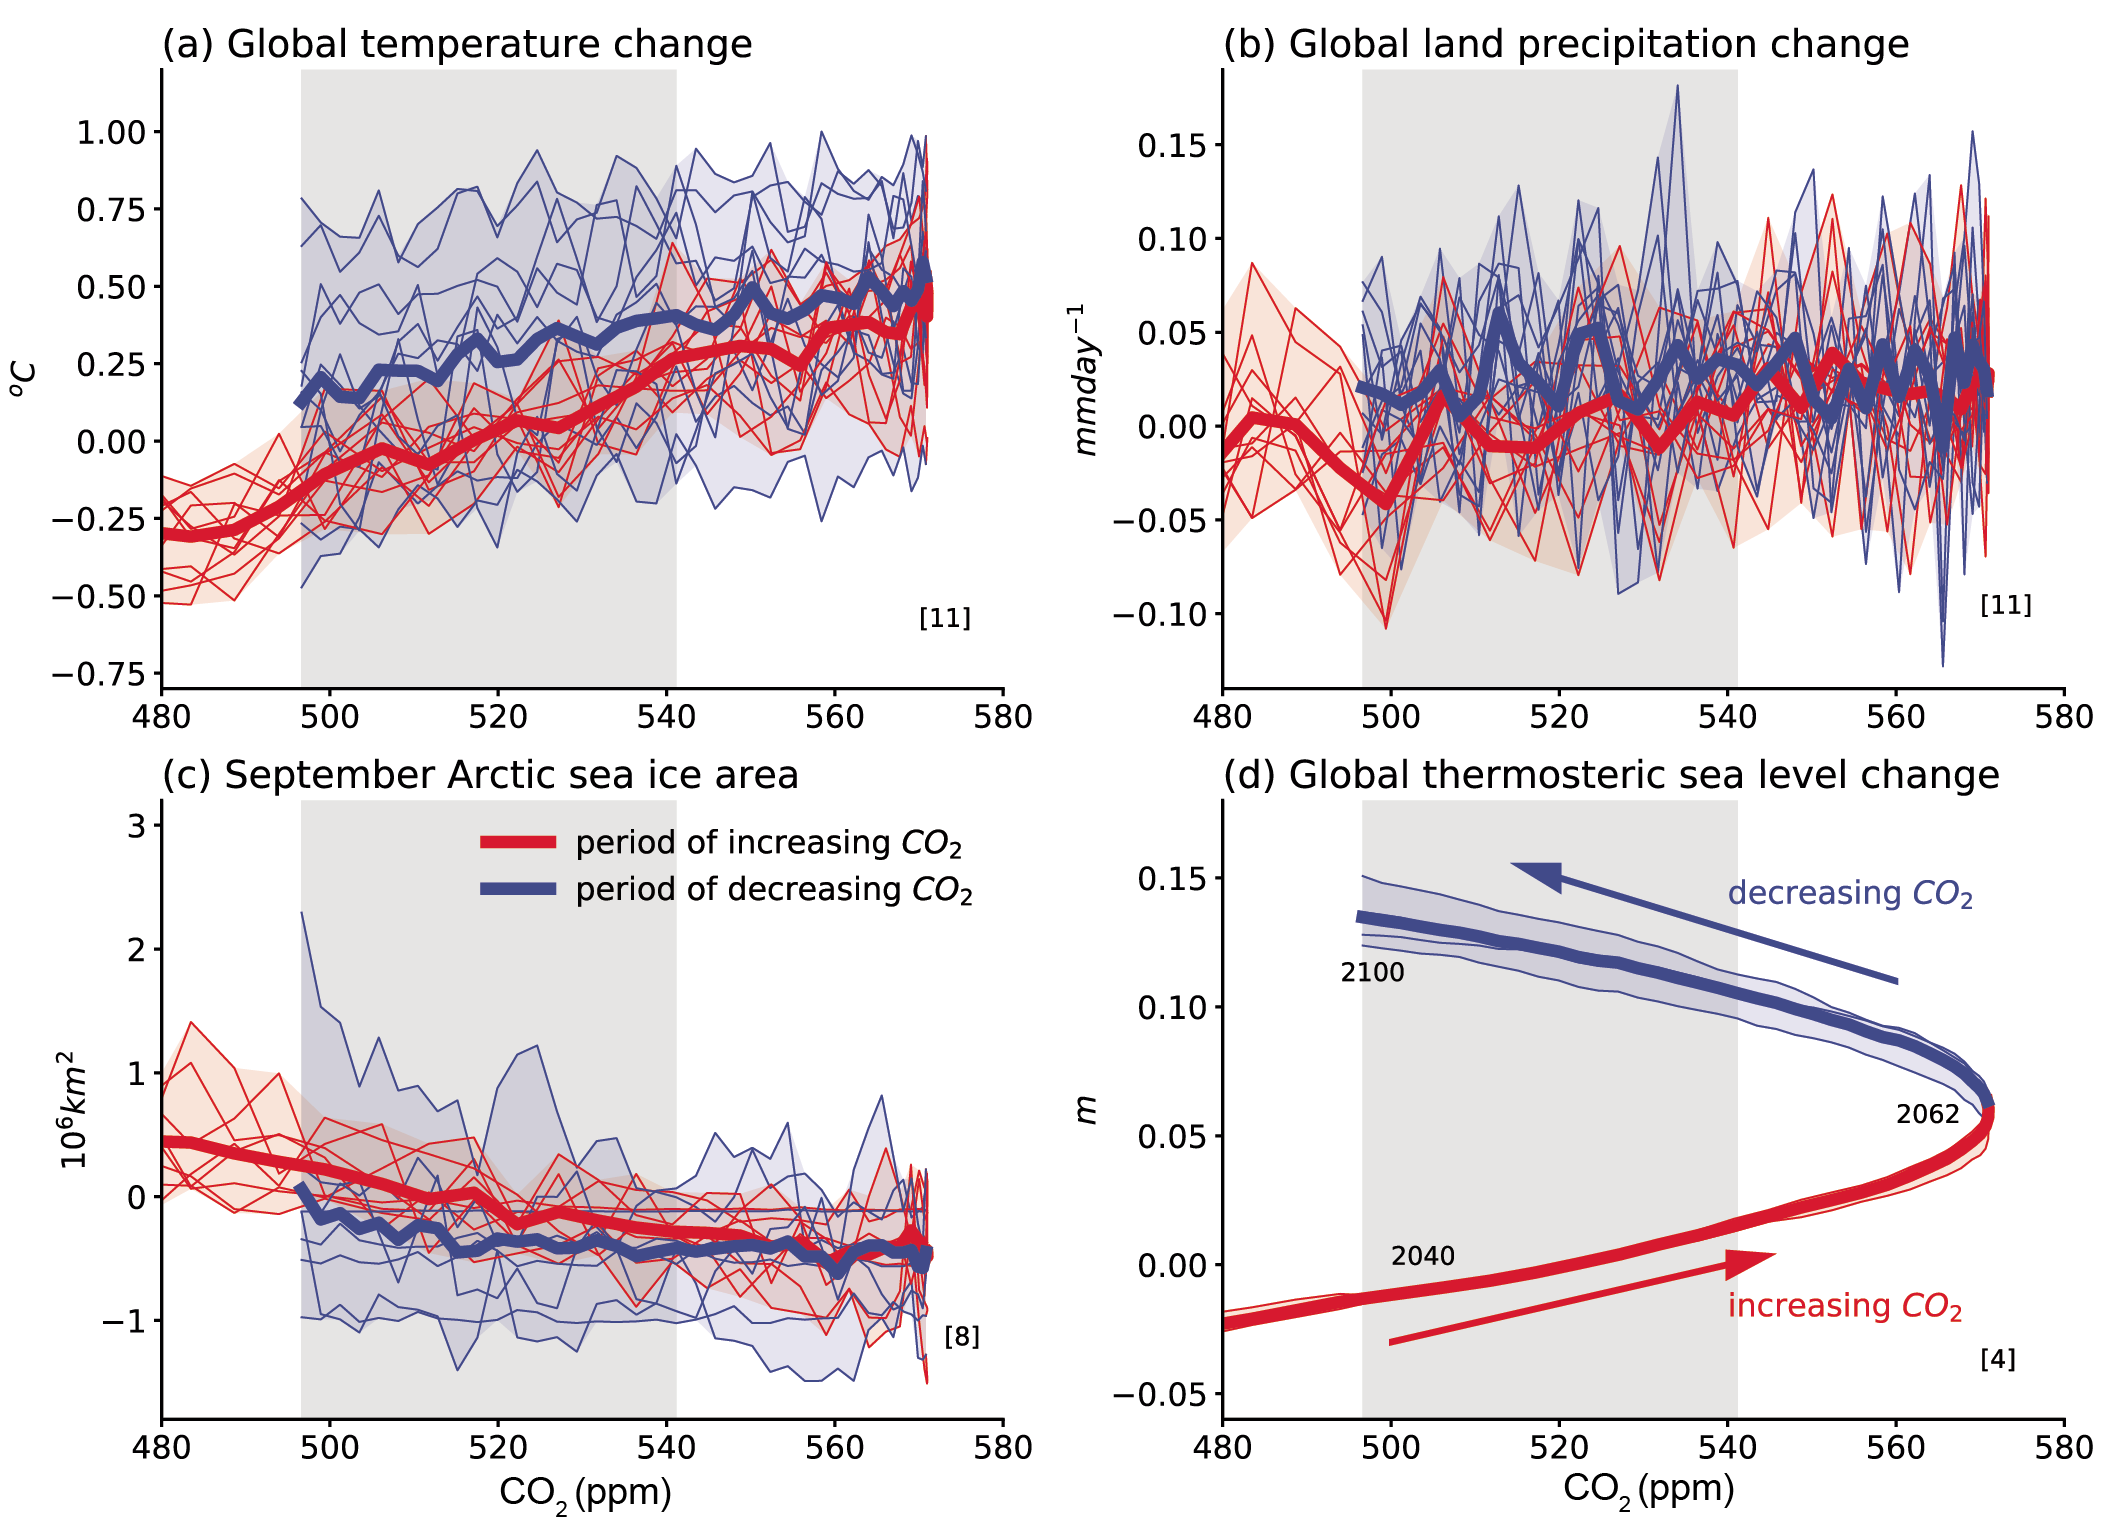
Figure caption
Figure 4.34 | Simulated changes in climate indices for SSP5-3.4-OS plotted against atmospheric CO2 concentration (ppm) from 480 up to 571 and back to 496 by 2100. (a) Global surface air temperature change; (b) Global land precipitation change; (c) September Arctic sea ice area change; (d) Global thermosteric sea level change. Plotted changes are relative to the 2034–2053 mean which has same CO2 as 2081–2100 mean (shaded grey bar). Red lines denote changes during the period up to 2062 when CO2 is rising, blue lines denote changes after 2062 when CO2 is decreasing again. Thick line is multi-model mean; thin lines and shading show individual models and complete model range. Numbers in square brackets indicate number of models used in each panel. Further details on data sources and processing are available in the chapter data table (Table 4.SM.1).