Back chapter figures
Figure 4.36
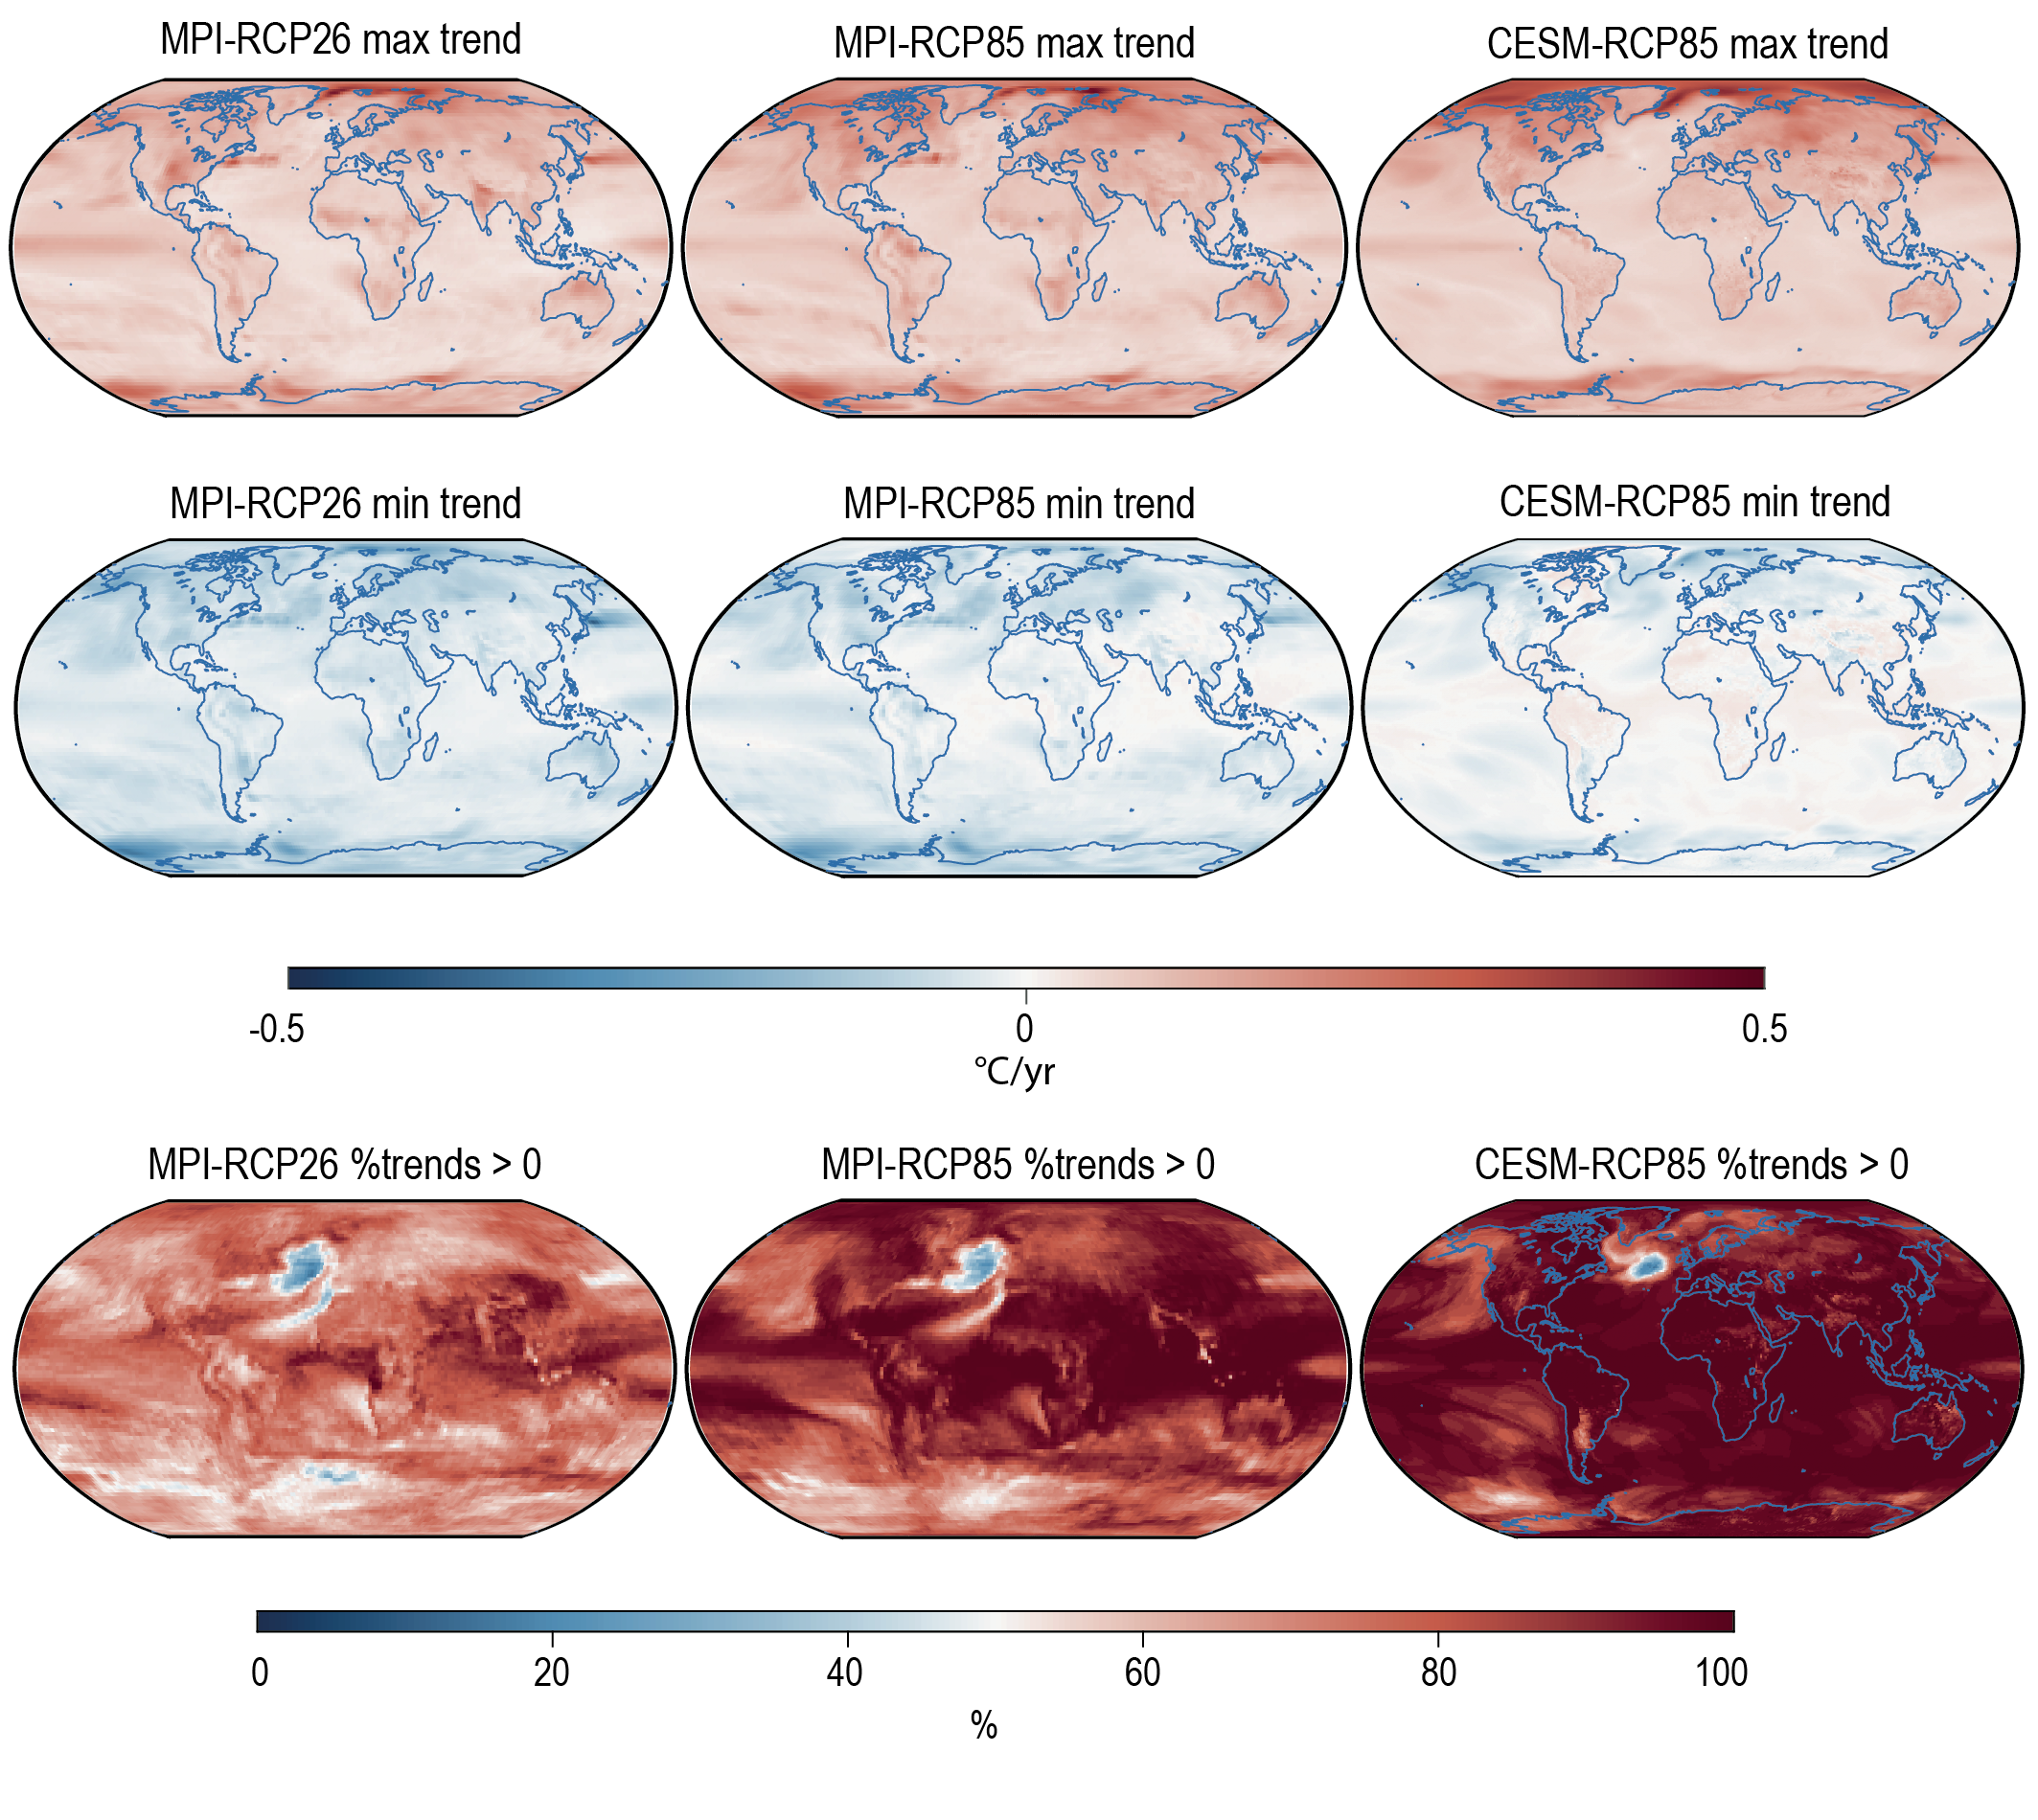
Figure caption
Figure 4.36 | Masking of climate response to mitigation by internal variability in the near term. Near-term (2021–2040) pointwise maximum (top row) and pointwise minimum (middle row) surface air temperature trends in the large initial-condition ensemble from MPI (left and centre columns), and CESM (right-hand column) models in the RCP2.6 (left-hand column) and RCP8.5 scenarios (centre and right columns). The percentage of ensemble members with a warming trend in the near term is shown in the bottom panels. Figure modified from Maher et al. (2020). Further details on data sources and processing are available in the chapter data table (Table 4.SM.1).