Back chapter figures
Figure 4.37
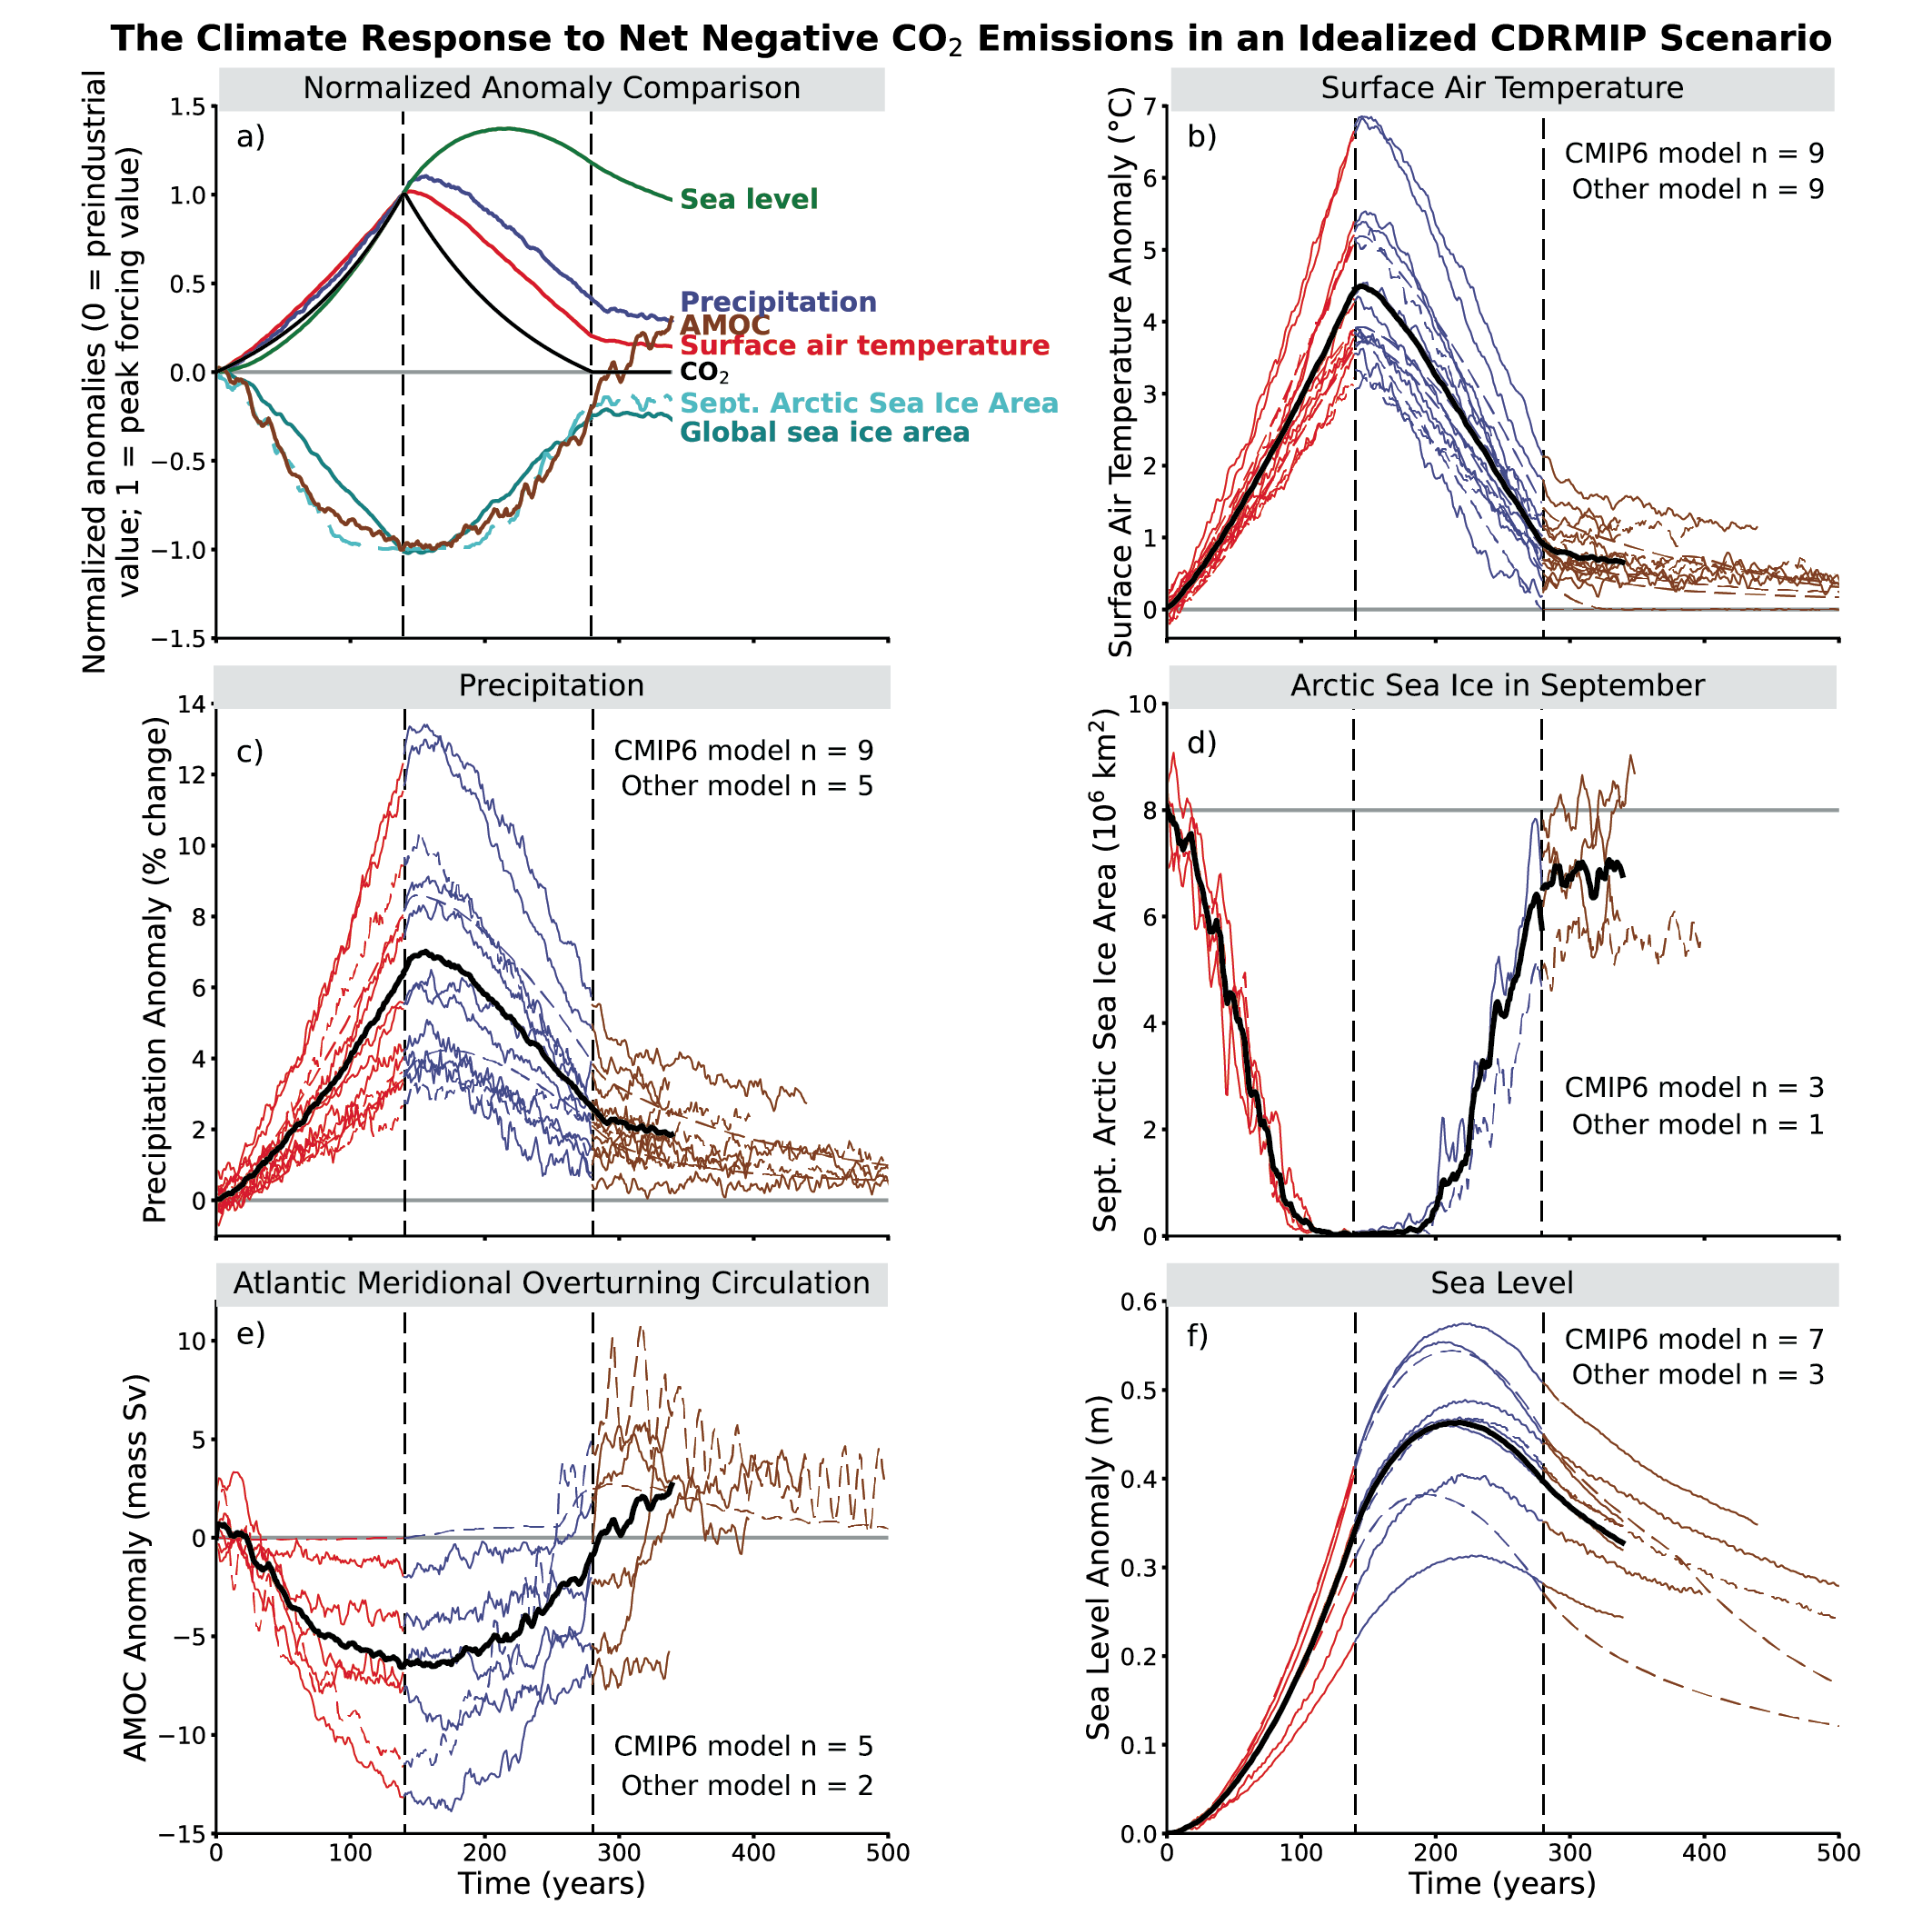
Figure caption
Figure 4.37 | Delayed climate response to carbon dioxide removal (CDR)-caused net negative CO2 emissions. Multi-model simulated response in global and annual mean climate variables for a ramp-up followed by ramp-down of CO2. Atmospheric CO2 increases from the pre-industrial level at a rate of 1% yr–1 to 4×CO2, then decreases at the same rate to the pre-industrial level and then remains constant. The ramp-down phase represents the period of net negative CO2 emissions. (a) Normalized ensemble mean anomaly of key variables as a function of year, including atmospheric CO2, surface air temperature, precipitation, thermosteric sea level change (see Glossary), global sea ice area, Northern Hemisphere sea ice area in September, and Atlantic meridional overturning circulation (AMOC); (b) surface air temperature; (c) precipitation; (d) September Arctic sea ice area; (e) AMOC; (f) thermosteric sea level; five-year running means are shown for all variables except the sea level change. In (b, f), red lines represent the phase of CO2 ramp-up, blue lines represent the phase of CO2 ramp-down, brown lines represent the period after CO2 has returned to pre-industrial level, and black lines represent the multi-model mean. For all of the segments in (b, f), the solid coloured lines are CMIP6 models, and the dashed lines are other models (i.e., EMICs, CMIP5-era models). Vertical dashed lines indicate peak CO2 and when CO2 again reaches pre-industrial value. The number of CMIP6 and non-CMIP6 models used is indicated in each panel. The time series for the multi-model means (b, f) and the normalized anomalies (a) are terminated when data from all models are not available, in order to avoid the discontinuity in the time series. Further details on data sources and processing are available in the chapter data table (Table 4.SM.1).