Back chapter figures
Figure 4.40
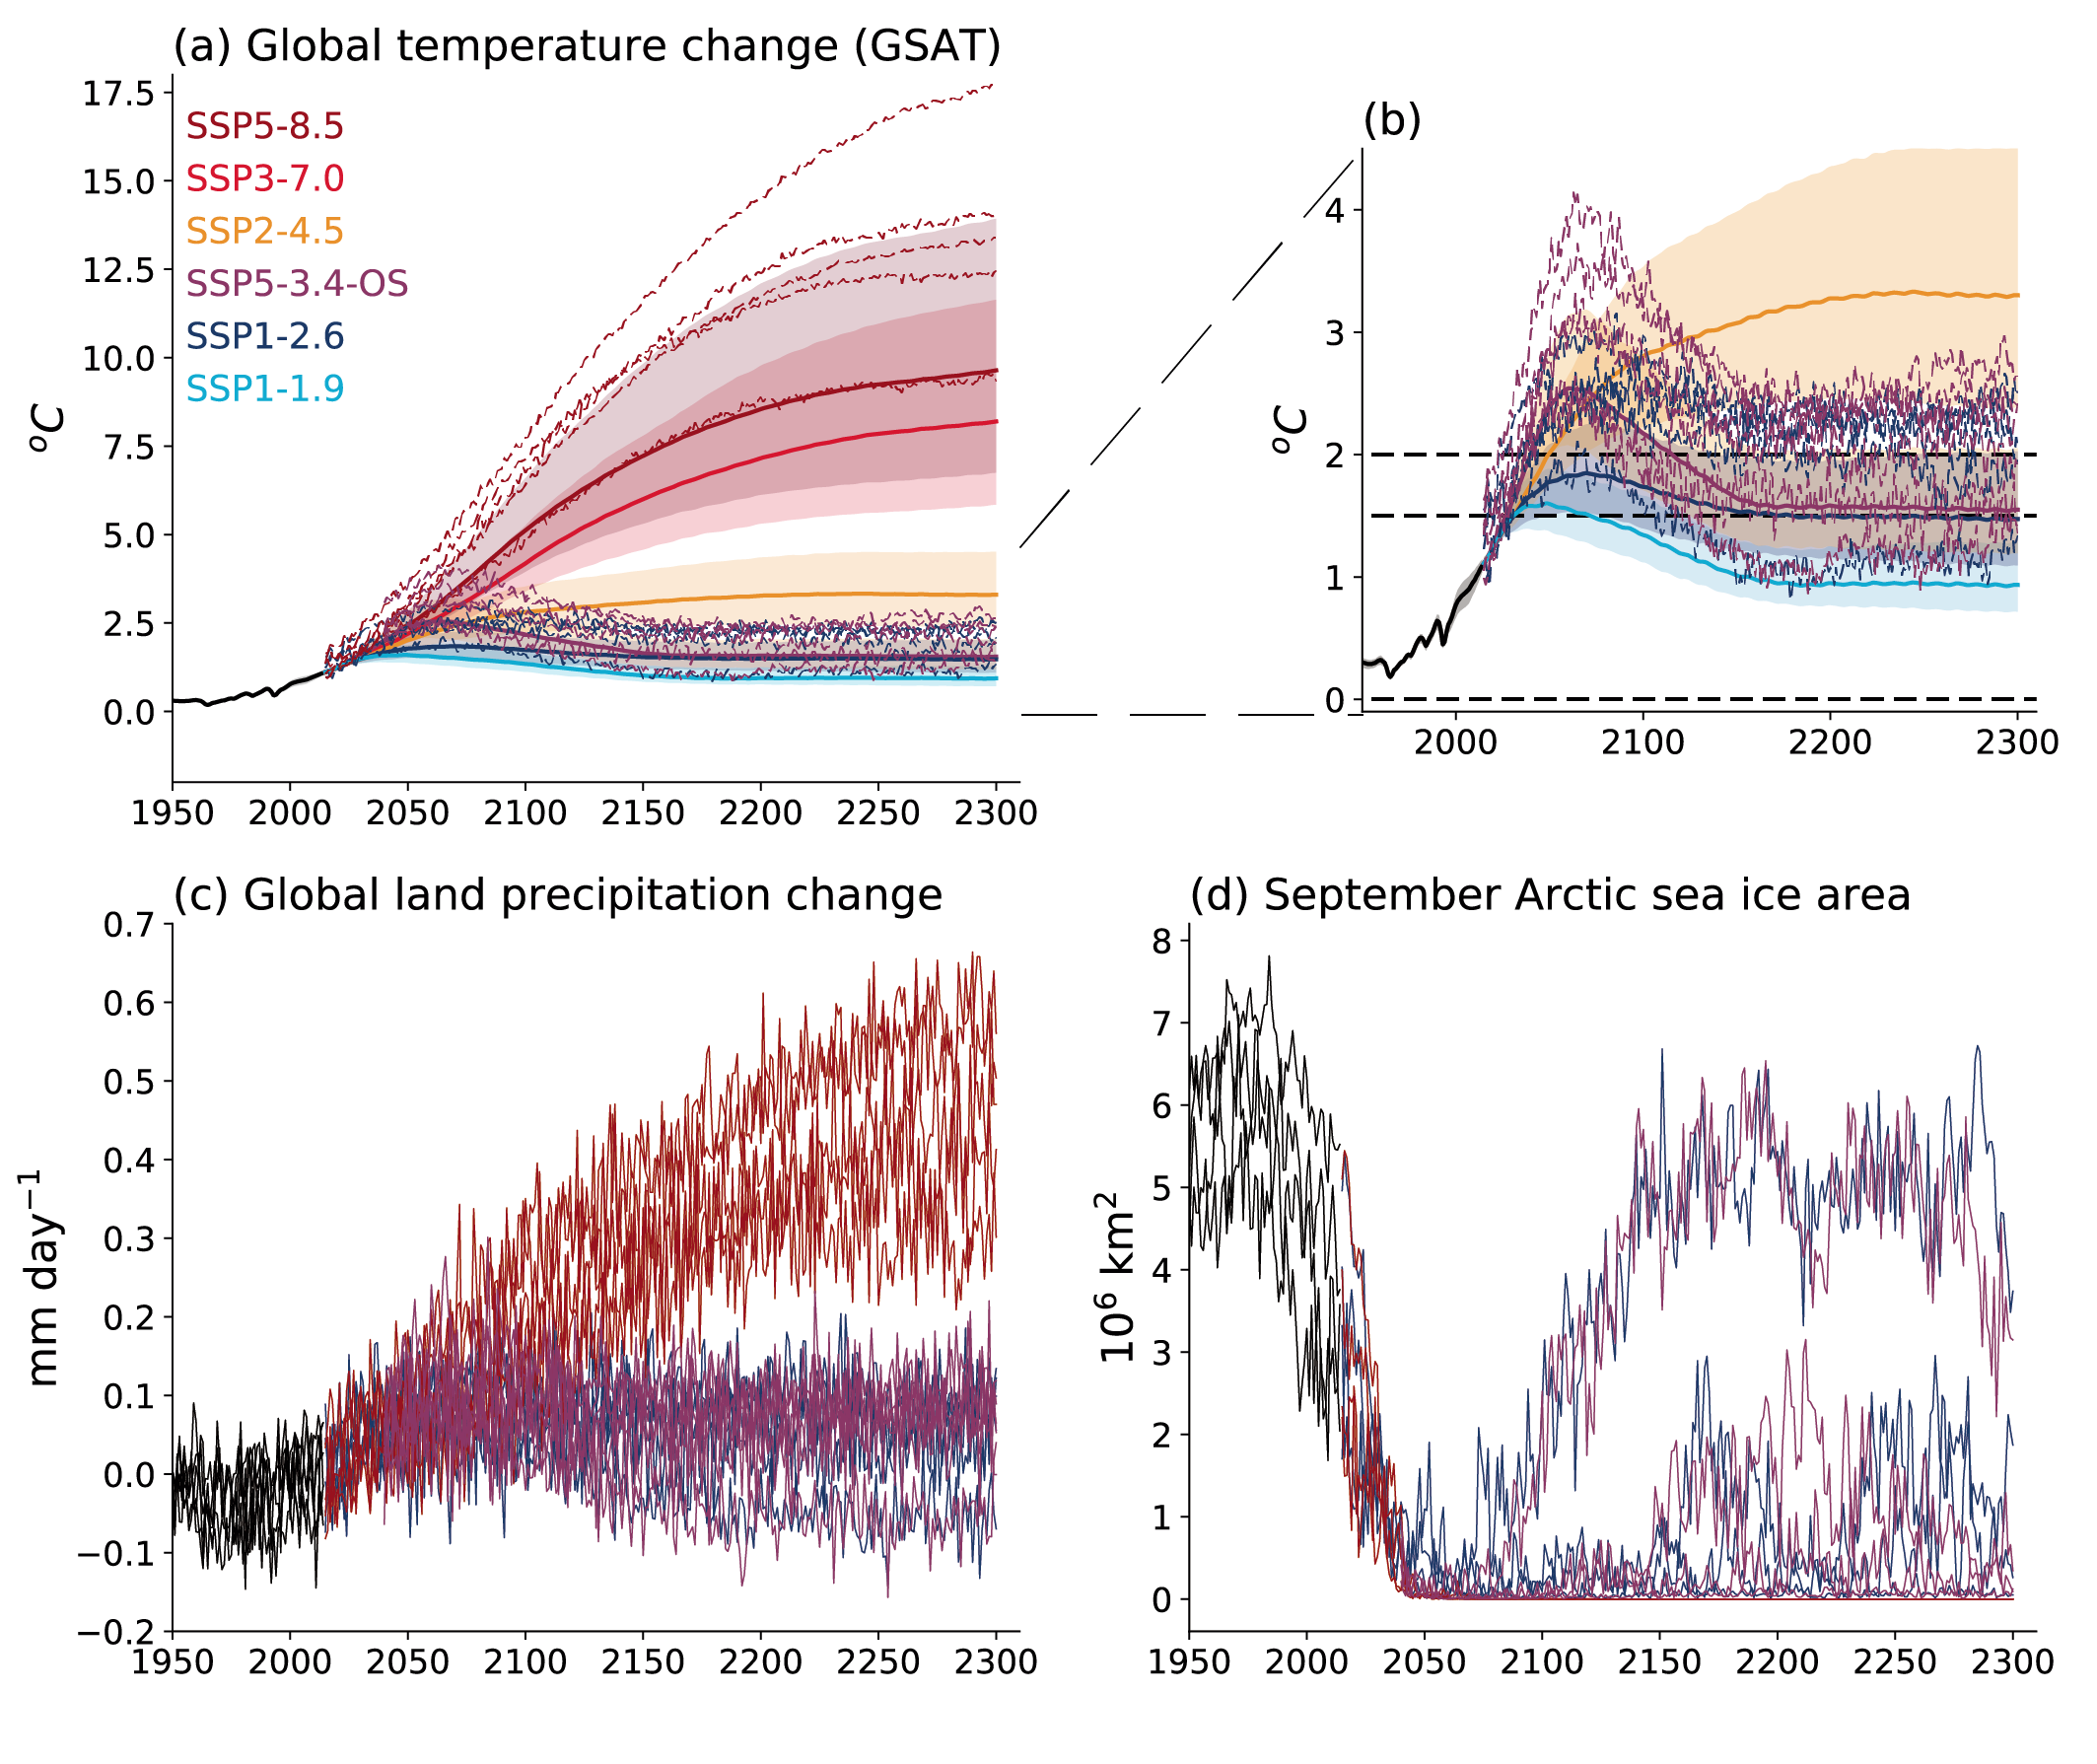
Figure caption
Figure 4.40 | Simulated climate changes up to 2300 under the extended SSP scenarios. Displayed are (a) projected global surface air temperature (GSAT) change, relative to 1850–1900, from CMIP6 models (individual lines) and MAGICC7 (shaded plumes); (b) as (a) but zoomed in to show low-emissions scenarios; (c) global land precipitation change; and (d) September Arctic sea ice area. Further details on data sources and processing are available in the chapter data table (Table 4.SM.1).