Figure 4.42
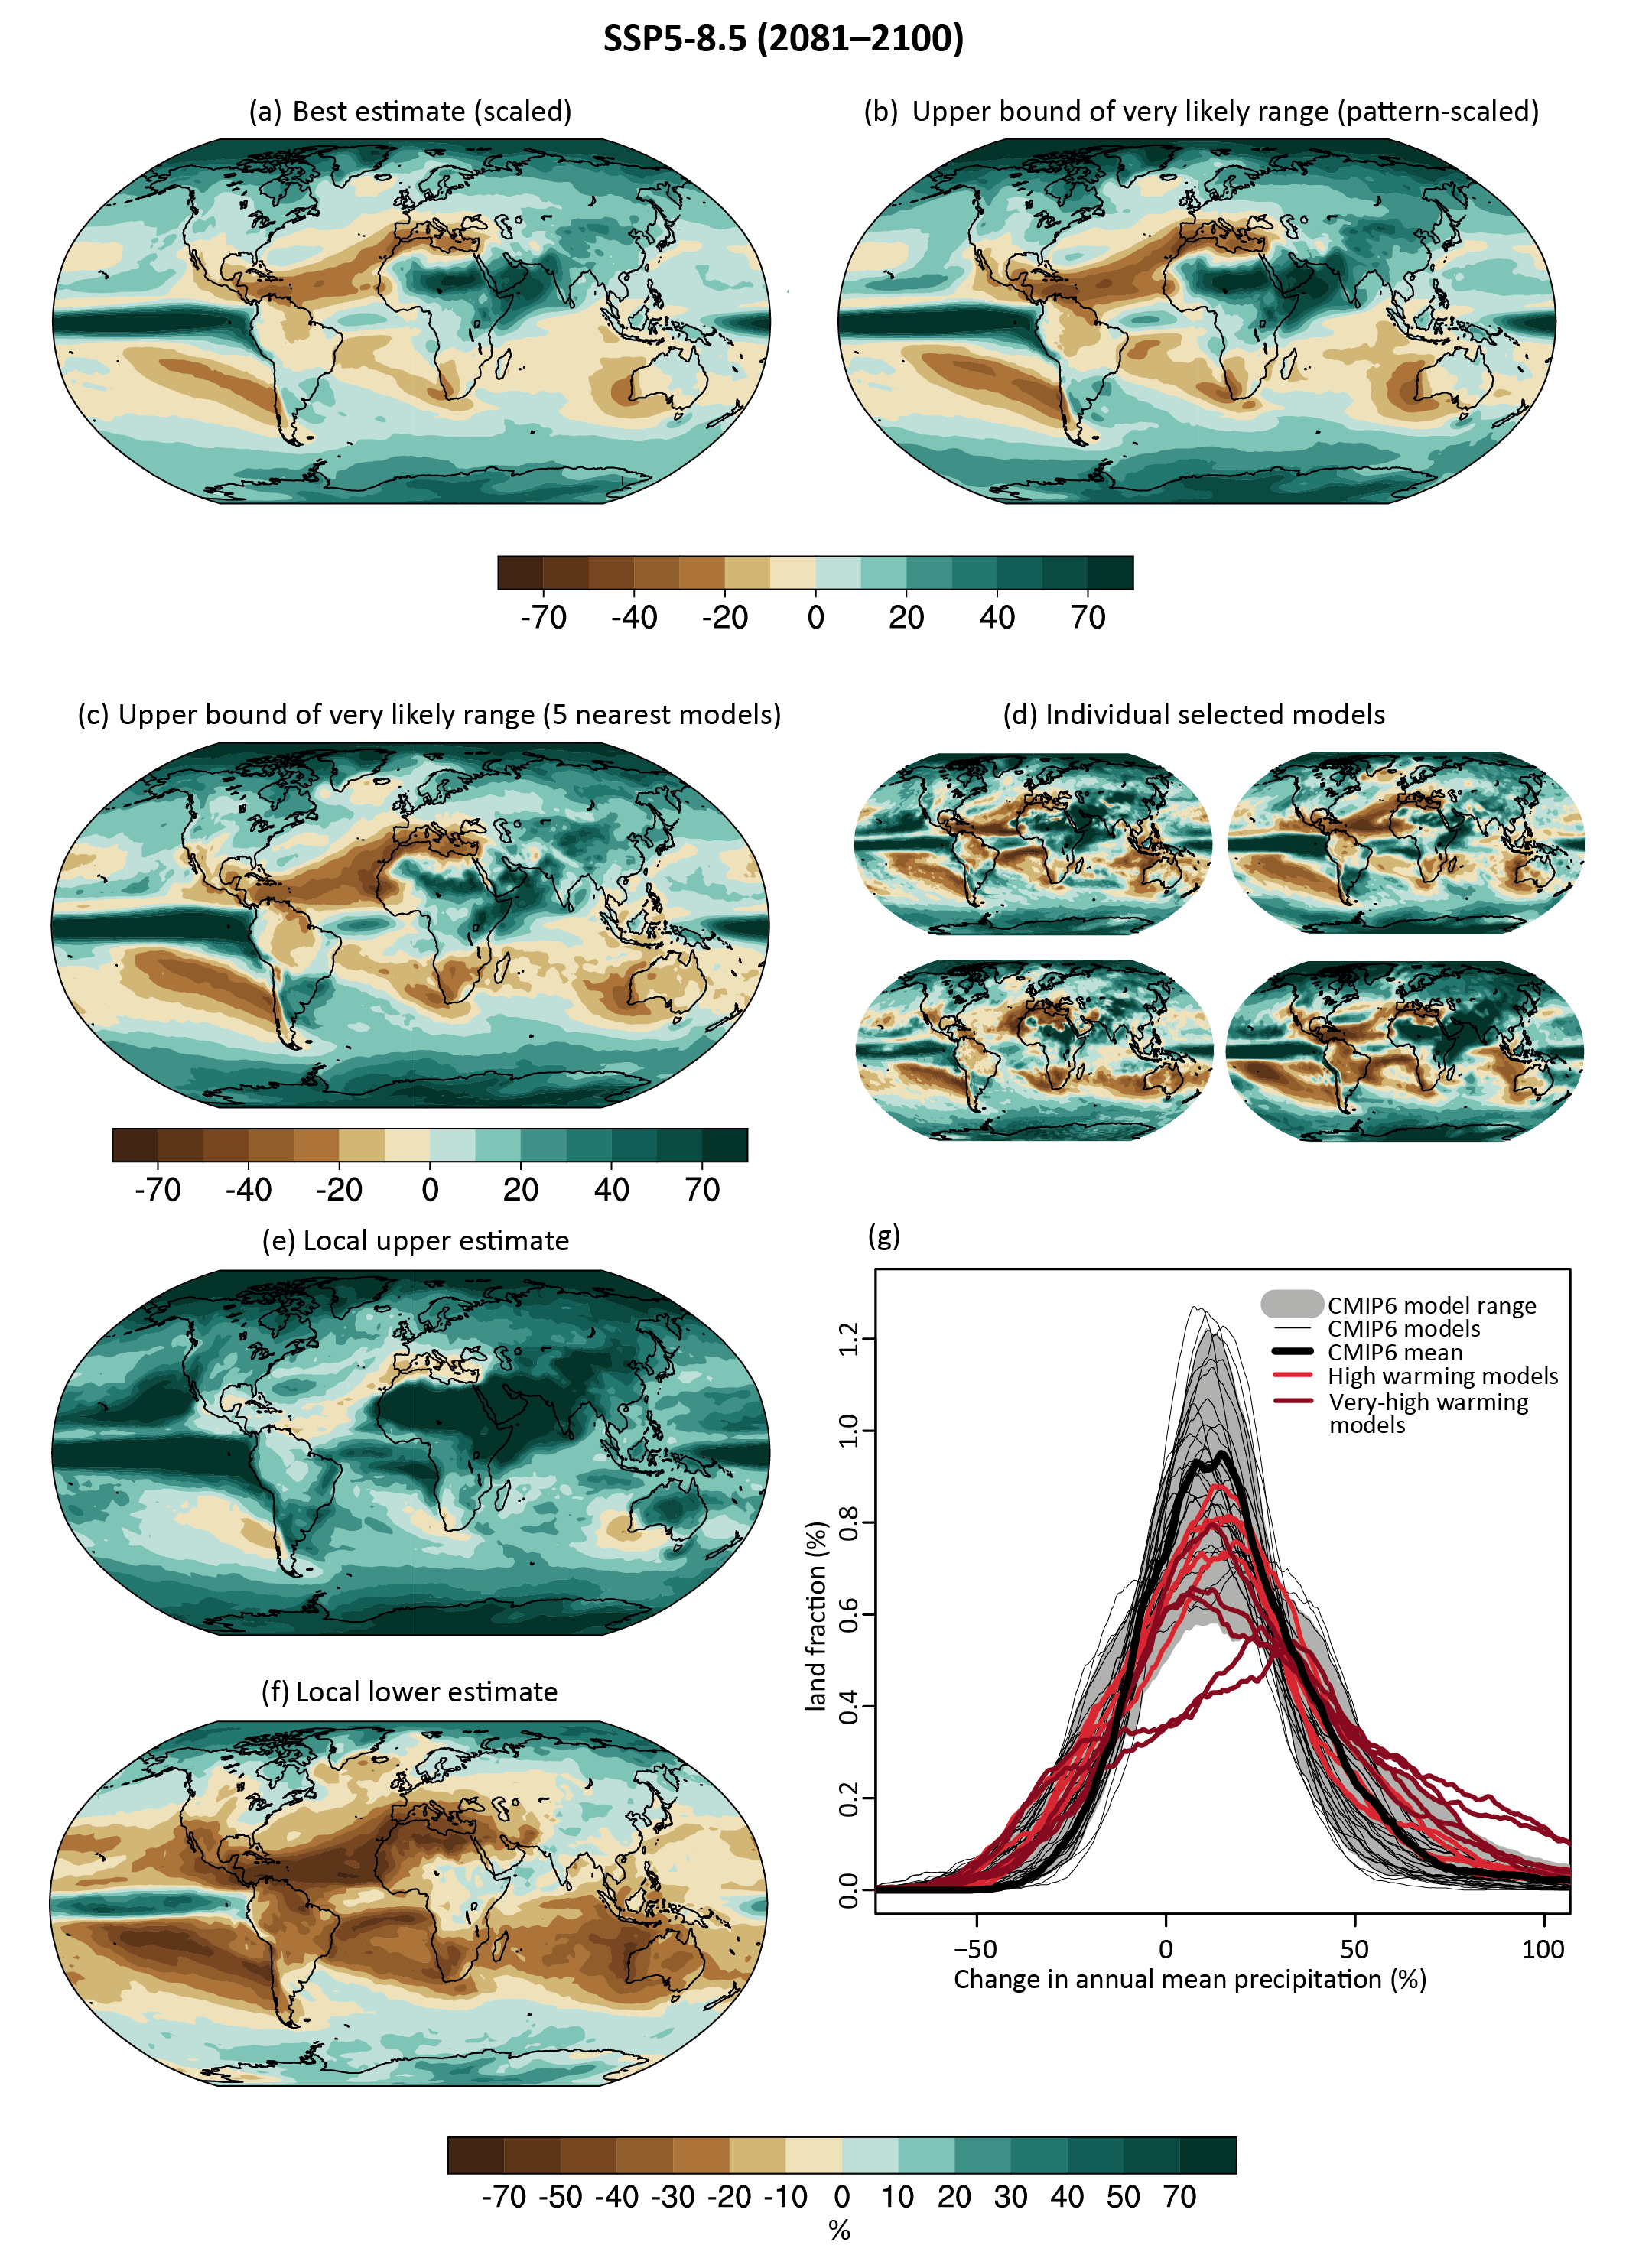
Figure caption
(a) Estimates for annual mean precipitation changes in 2081–2100, relative to 1995–2014, consistent with the best global surface air temperature (GSAT) estimate derived by linearly scaling the CMIP6 multi-model mean changes to a GSAT change of 3.5°C. (b, c) Estimates for annual mean precipitation changes in 2081–2100 relative 1995–2014 in a storyline representing a physically plausible high-global-warming level. (b) Multi-model-mean precipitation scaled to high-global-warming level (corresponding to 4.8°C, the upper bound of the very likely range; see Section 4.3.4). (c) Average of five models with GSAT warming nearest to the high level of warming (ACCESS-CM2, CESM2, CESM2-WACCM, CNRM-CM6-1, CNRM-CM6-1-HR) (d) Annual mean precipitation changes in four of the five individual model simulations averaged in (c). (e, f) Local upper estimate (95% quantile across models) and lower estimate (5% quantile across models) at each grid point. Information at individual grid points comes from different model simulations and illustrates local uncertainty range but should not be interpreted as a pattern. (g) Area fraction of changes in annual mean precipitation 2081–2100 relative to 1995–2014 for (i) all CMIP6 model simulations (thin black lines), (ii) models shown in (c) (red lines), and (iii) models showing very high warming above the models shown in (c) (dark red lines). The grey range illustrates the 5–95% range across CMIP6 models and the solid black line the area fraction of the multi-model mean pattern shown in (a). Further details on data sources and processing are available in the chapter data table (Table 4.SM.1).