Back chapter figures
Figure 4.5
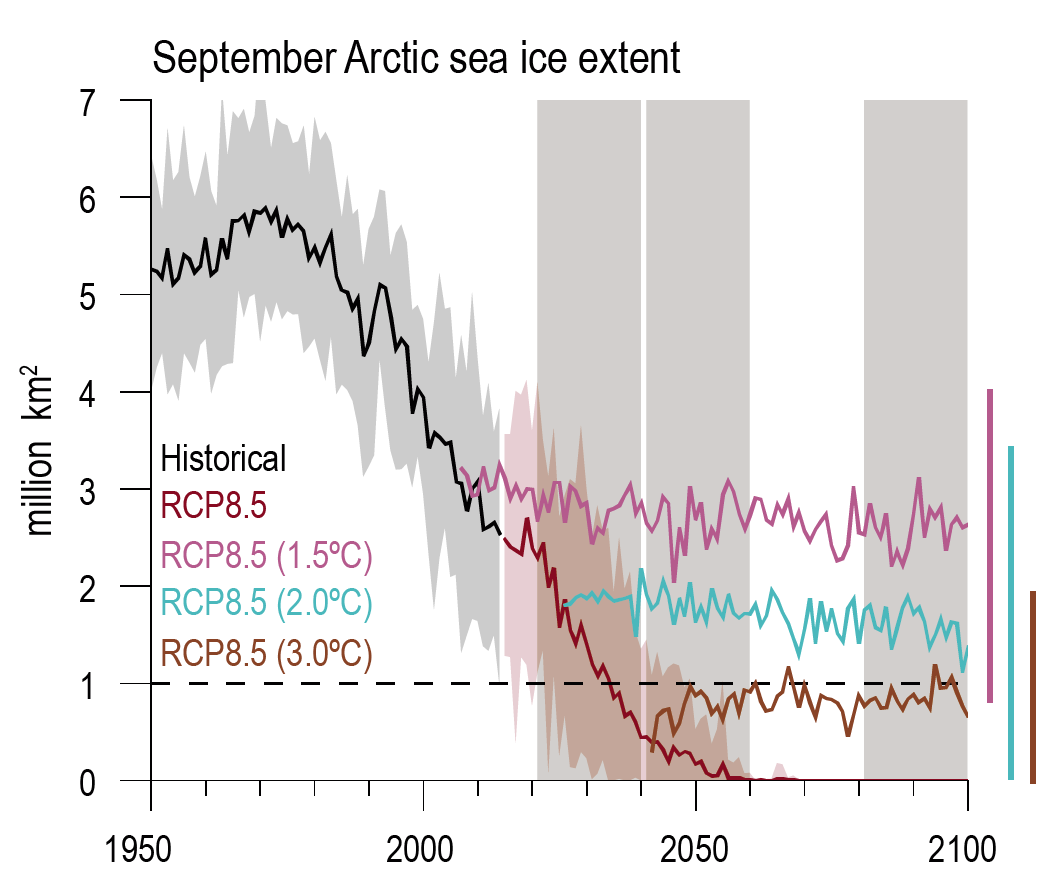
Figure caption
Figure 4.5 | Arctic sea ice extent in September in a large initial-condition ensemble of observationally-constrained simulations of an Earth system model (CanESM2). The black and red curves are averages over twenty simulations following historical forcings to 2015 and RCP8.5 extensions to 2100. The other curves are averages of over 20 simulations each after global surface air temperature has been stabilized at the indicated degree of global mean warming relative to 1850–1900. The bars to the right are the minimum to maximum ranges over 2081–2100 (Sigmond et al., 2018). The horizontal dashed line indicates a practically sea ice-free Arctic. Further details on data sources and processing are available in the chapter data table (Table 4.SM.1).