Back chapter figures
Figure 4.6
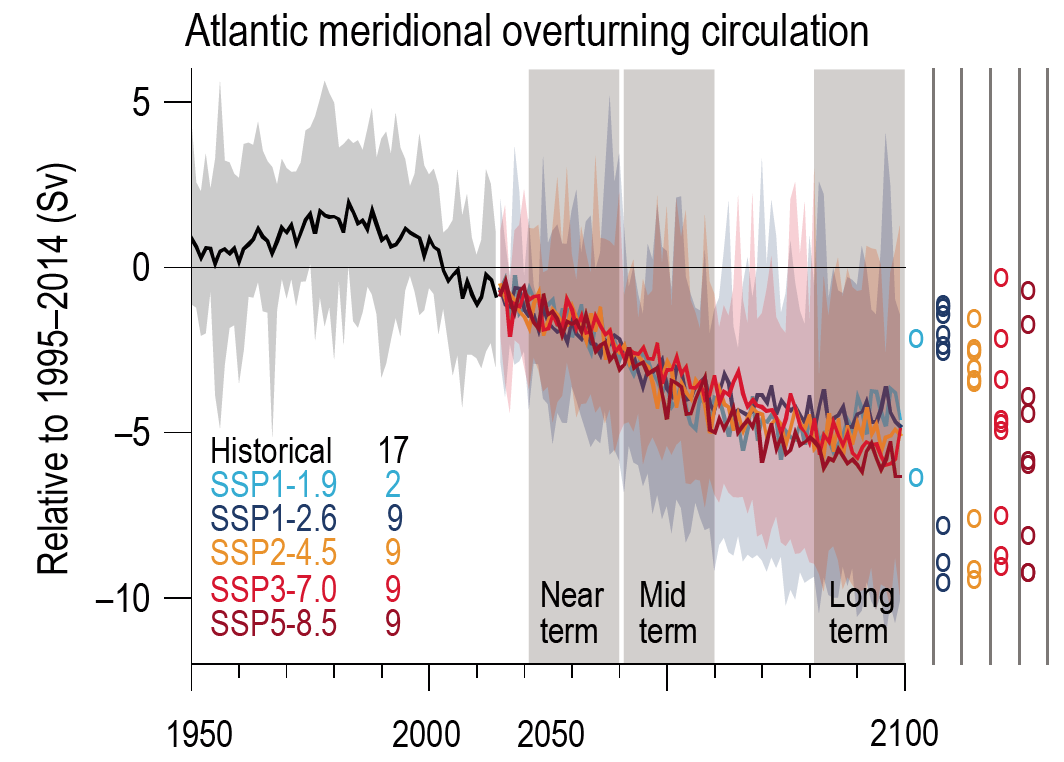
Figure caption
Figure 4.6 | CMIP6 annual mean Atlantic Meridional Overturning Circulation (AMOC) strength change in historical and scenario simulations. Changes are relative to averages from 1995–2014. The curves show ensemble averages and the shadings the 5–95% ranges across the SSP1-2.6 and SSP3-7.0 ensembles. The circles to the right of the panel show the anomalies averaged from 2081–2100 for each of the available model simulations. The numbers inside the panel are the number of model simulations. Here, the strength of the AMOC is computed as the maximum value of annual mean ocean meridional overturning mass stream function in the Atlantic at 26°N. Results are from concentration-driven simulations. Further details on data sources and processing are available in the chapter data table (Table 4.SM.1).