Back chapter figures
Figure 4.7
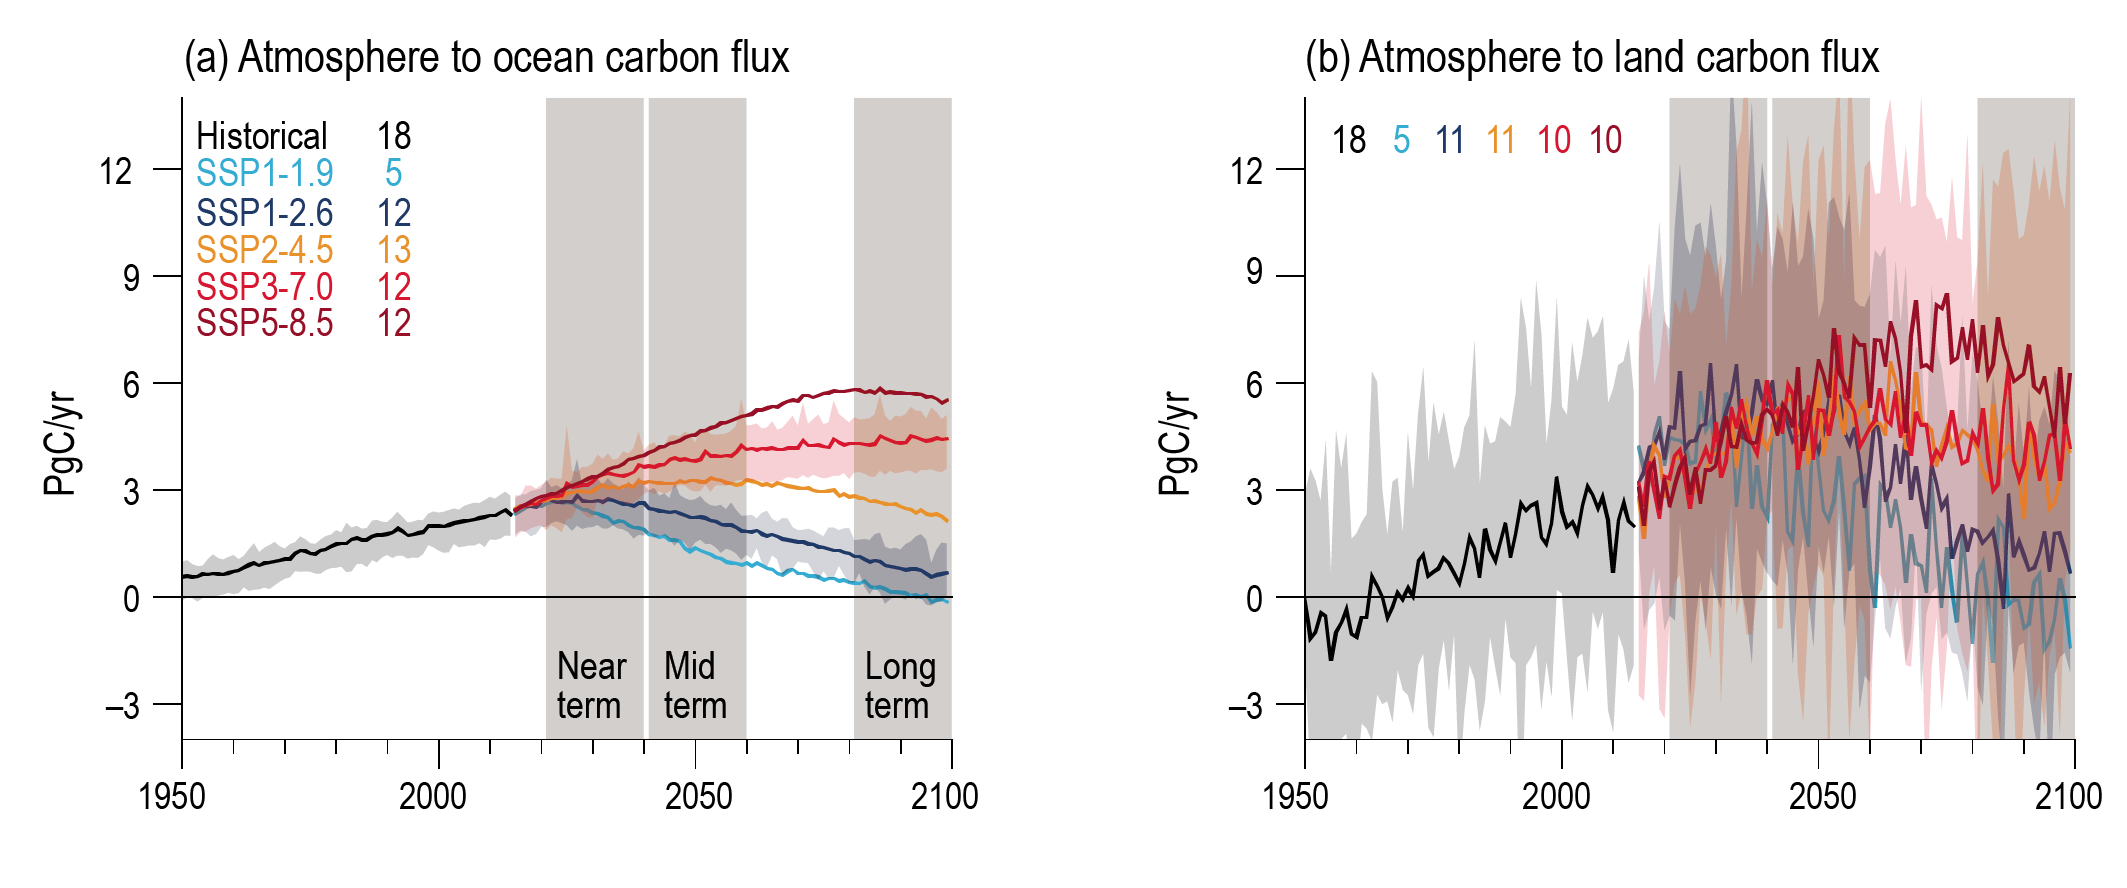
Figure caption
Figure 4.7 | CMIP6 carbon uptake in historical and scenario simulations. (a) Atmosphere to ocean carbon flux (PgC yr–1). (b) Atmosphere to land carbon flux (PgC yr–1). The curves show ensemble averages and the shadings show the 5–95% ranges across the SSP1-2.6 and SSP3-7.0 ensembles. The numbers inside each panel are the number of model simulations. The land uptake is taken as Net Biome Productivity (NBP) and so includes any modelled net land-use change emissions. Results are from concentration-driven simulations. Further details on data sources and processing are available in the chapter data table (Table 4.SM.1).