Box 5.3, Figure 1
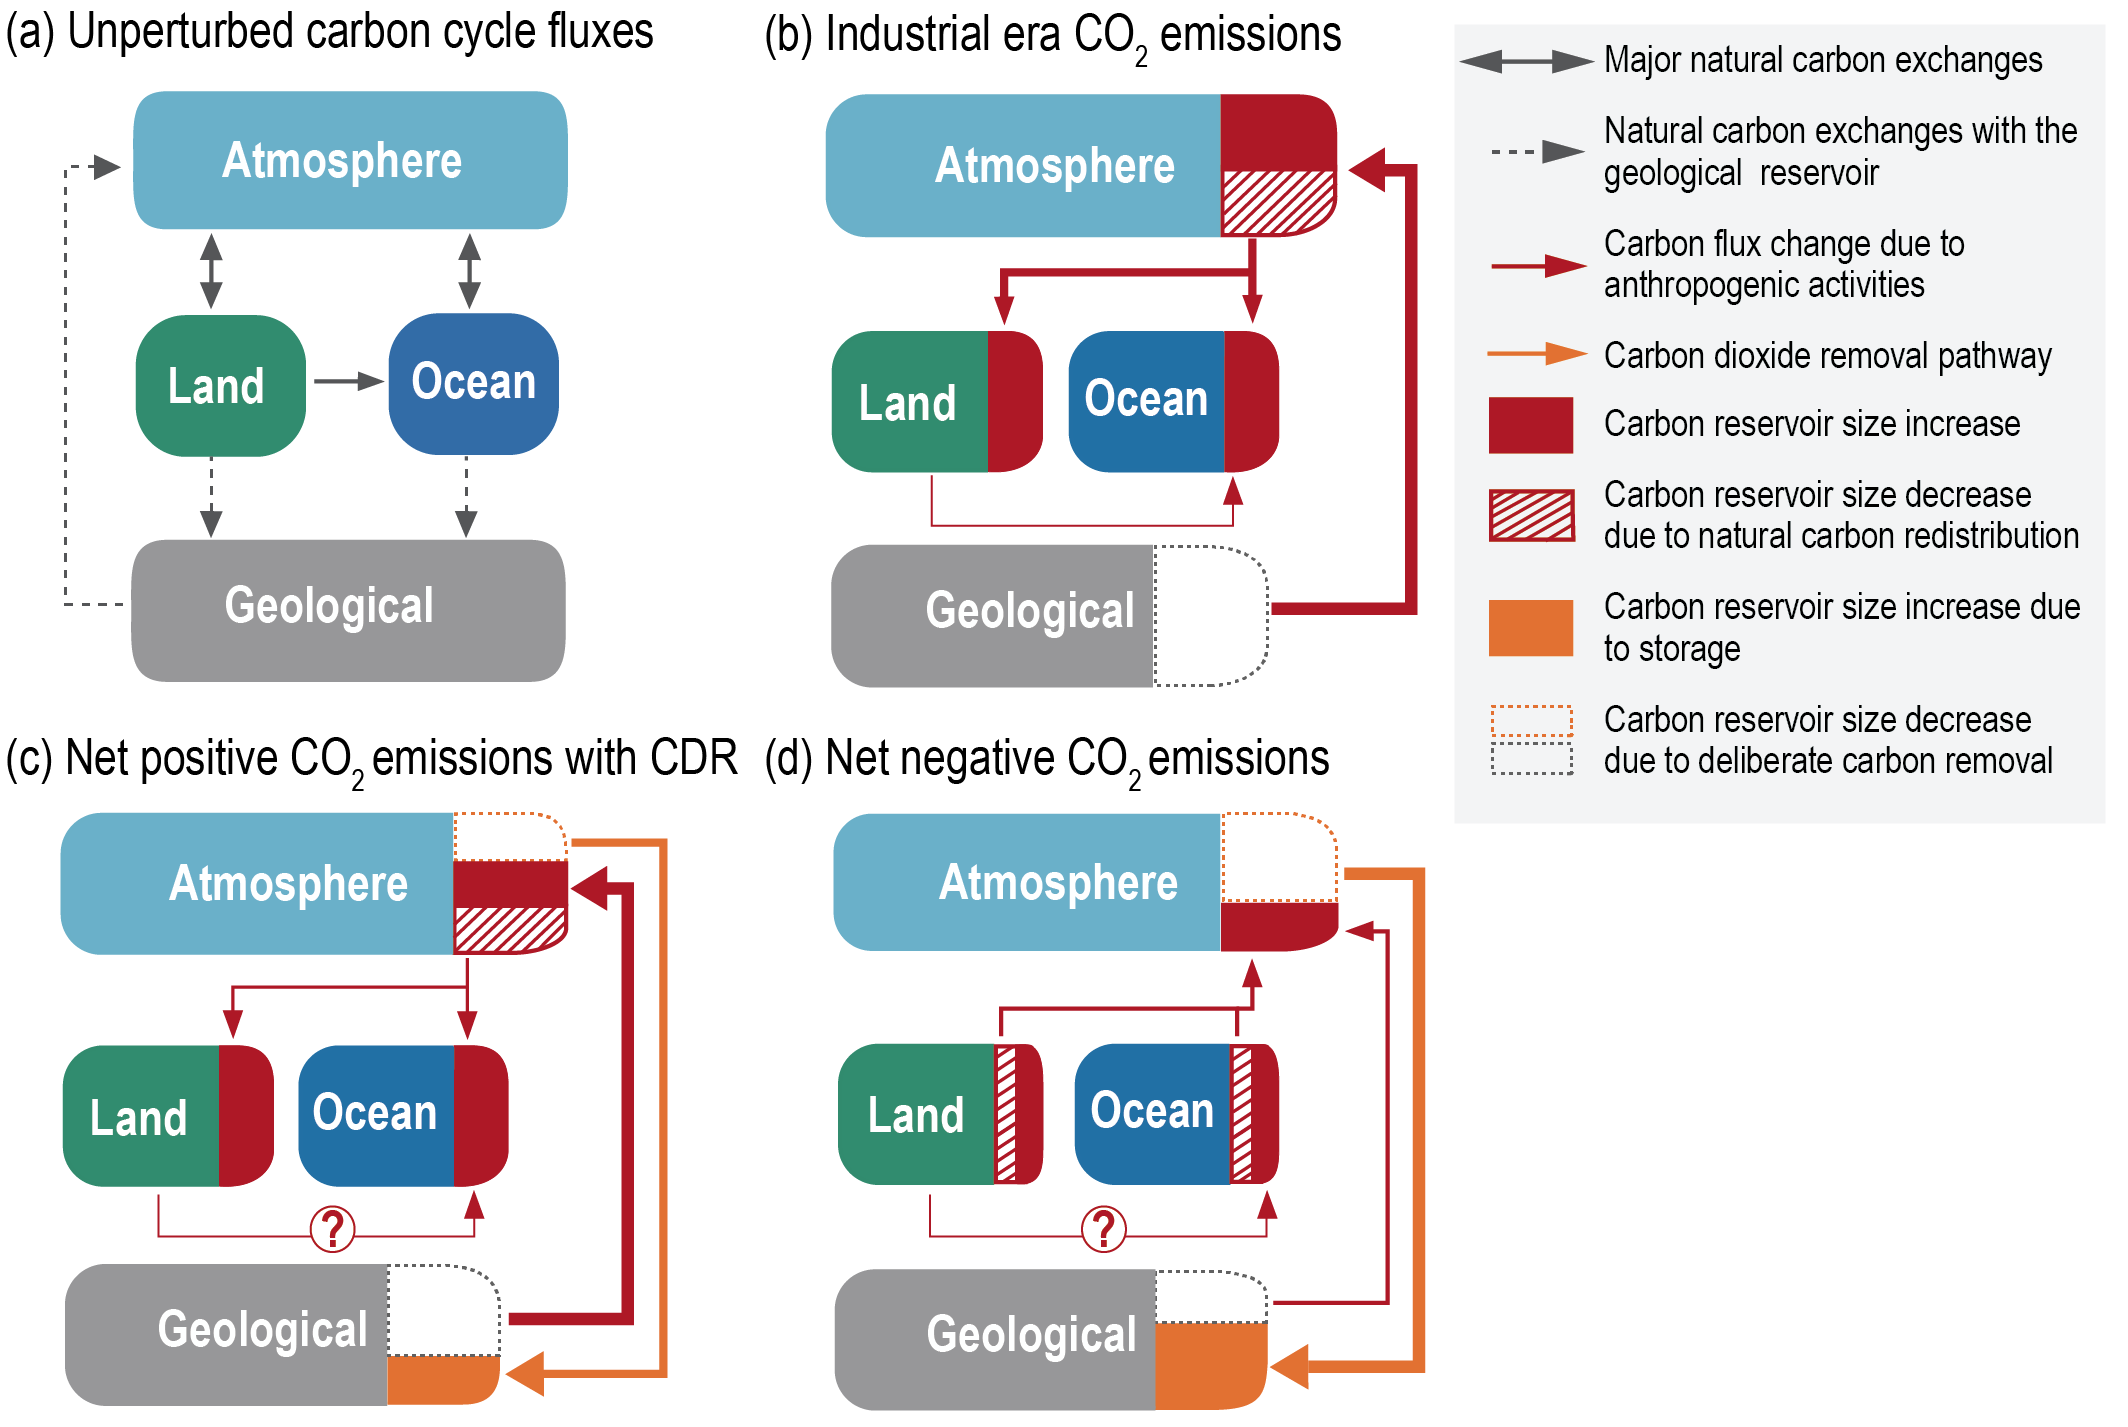
Figure caption
Box 5.3, Figure 1 | Schematic representation of carbon fluxes between atmosphere, land, ocean and geological reservoirs. Different system conditions are shown: (a) an unperturbed Earth system; and changes in carbon fluxes for (b) an Earth system perturbed by fossil fuel carbon dioxide (CO2) emissions; (c) an Earth system in which fossil fuel CO2 emissions are partially offset by carbon dioxide removal (CDR); (d) an Earth system in which CDR exceeds CO2 emissions from fossil fuels (‘net negative’ CO2 emissions). Carbon fluxes depicted in (a) (solid and dashed black lines) also occur in (b–d). The question mark in the land-to-ocean carbon flux perturbation in (c) and (d) indicates that the effect of CDR on this flux is unknown. Note that box sizes do not scale with the size of carbon reservoirs. Adapted from Keller et al. (2018a) . Further details on data sources and processing are available in the chapter data table (Table 5.SM.6).