Cross-Chapter Box 5.2, Figure 2
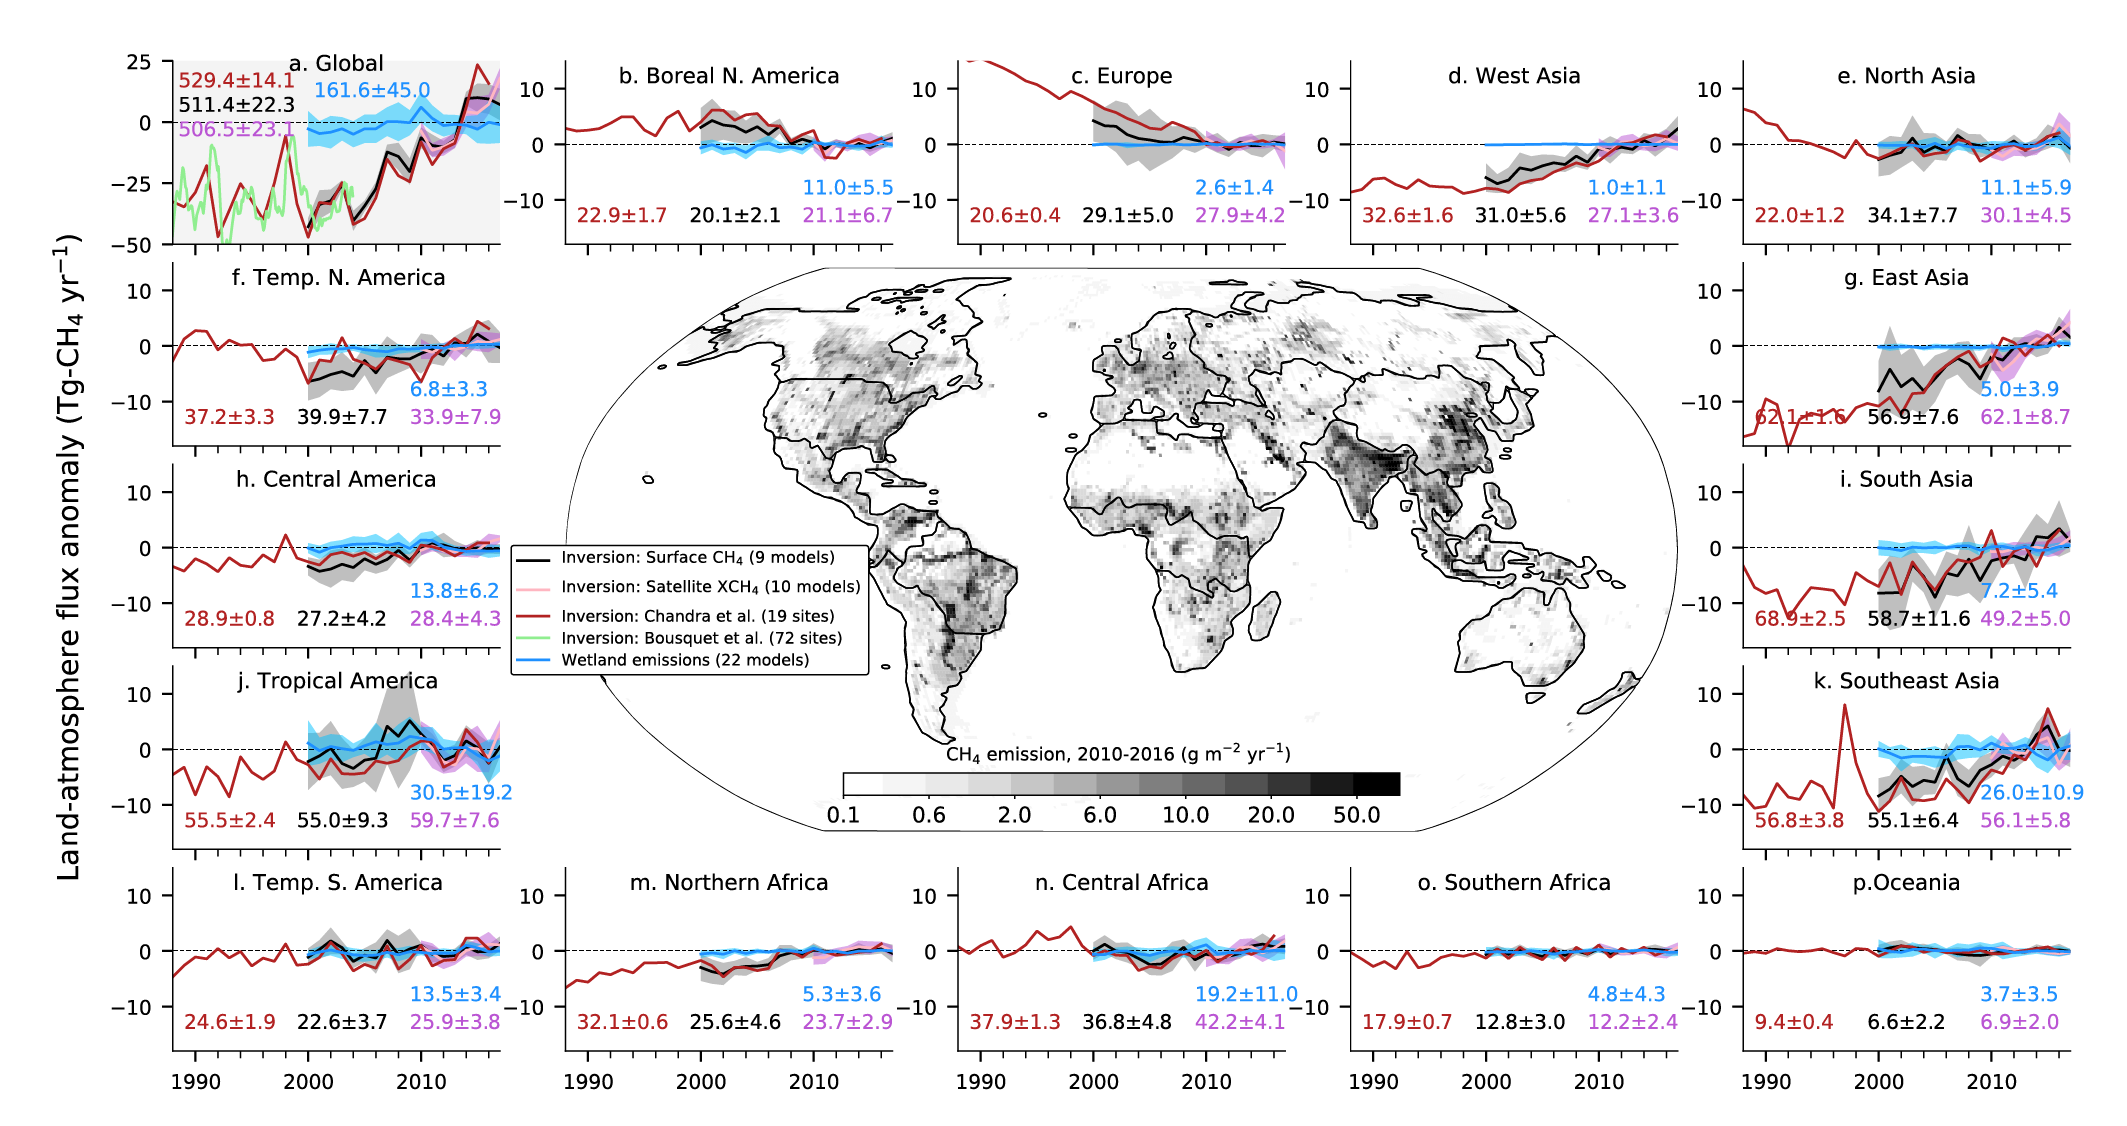
Figure caption
Cross-Chapter Box 5.2, Figure 2 | Anomalies in global and regional methane (CH4) emissions for 1988–2017. The map in the centre shows mean CH4 emissions for 2010–2016. Multi-model mean (line) and 1-s standard deviations (shaded) for 2000–2017 are shown for 9 surface CH4 and 10 satellite XCH4 inversions, and 22 wetland models or model variants that participated in GCP-CH4 budget assessment (Saunois et al., 2020). The results for the period before 2000 are available from two inversions, one using 19 sites (Chandra et al., 2021; also used for the 2010–2016 mean emissions map) and one for global totals (Bousquet et al., 2006). The long-term mean values for 2010–2016 (common for all GCP–CH4 inversions), as indicated within each panel separately, are subtracted from the annual-mean time series for the calculation of anomalies for each region. Further details on data sources and processing are available in the chapter data table (Table 5.SM.6).