Back chapter figures
FAQ 5.1 Figure 1
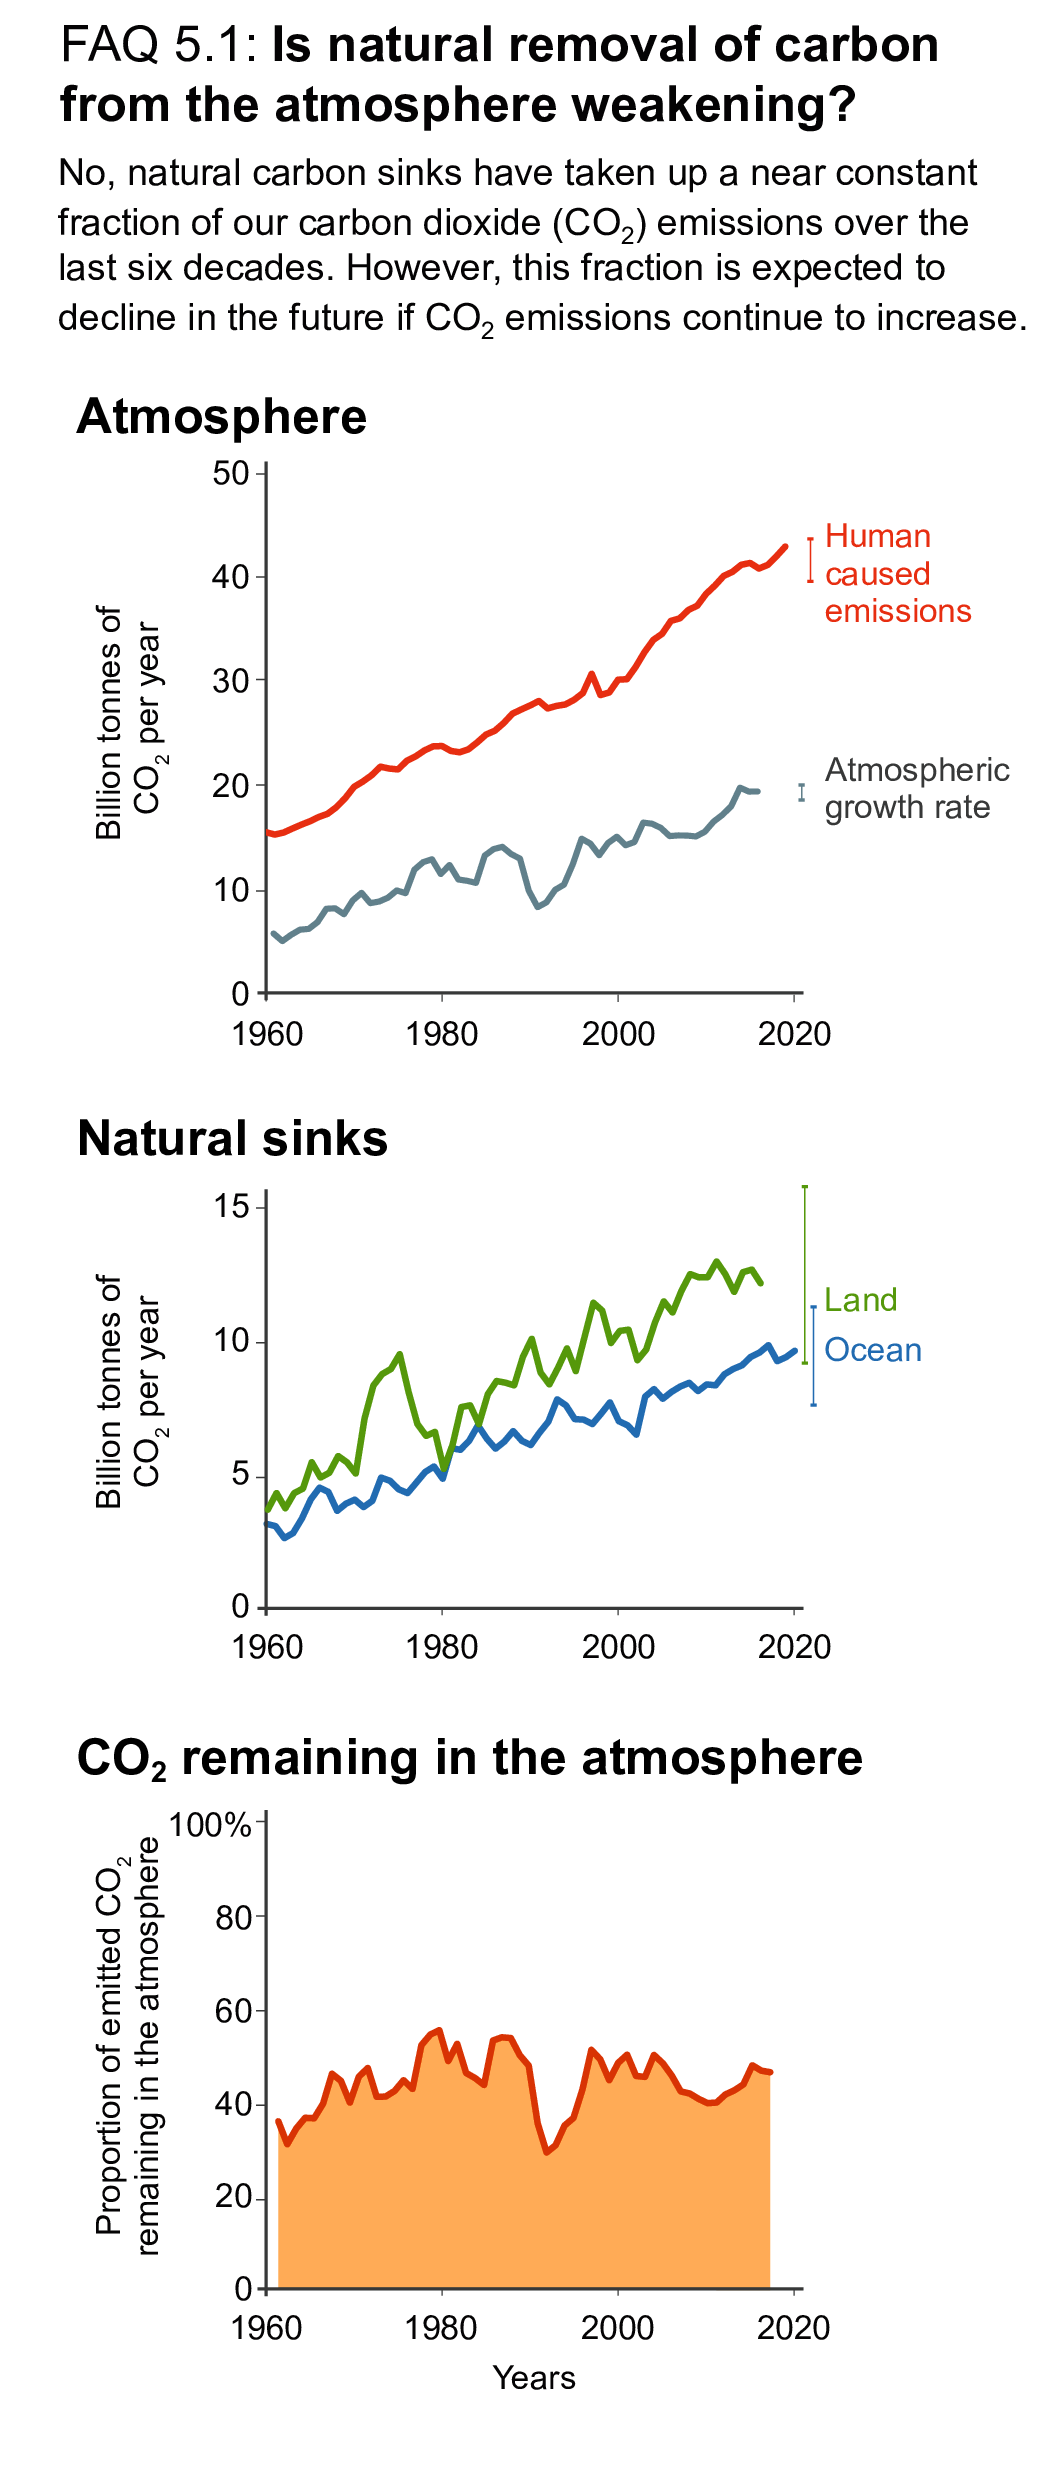
Figure caption
FAQ5.1, Figure 1 | Atmospheric carbon dioxide (CO2) and natural carbon sinks. (Top) Global emissions of CO2 from human activities and the growth rate of CO2 in the atmosphere; (middle) the net land and ocean CO2 removal (natural sinks); and (bottom) the fraction of CO2 emitted by human activities remaining in atmosphere from 1960 to 2019. Lines are the five years running mean, error bars denote the uncertainty of the mean estimate. See Table 5.SM.6 for more information on the data underlying this figure.