FAQ 5.3 Figure 1
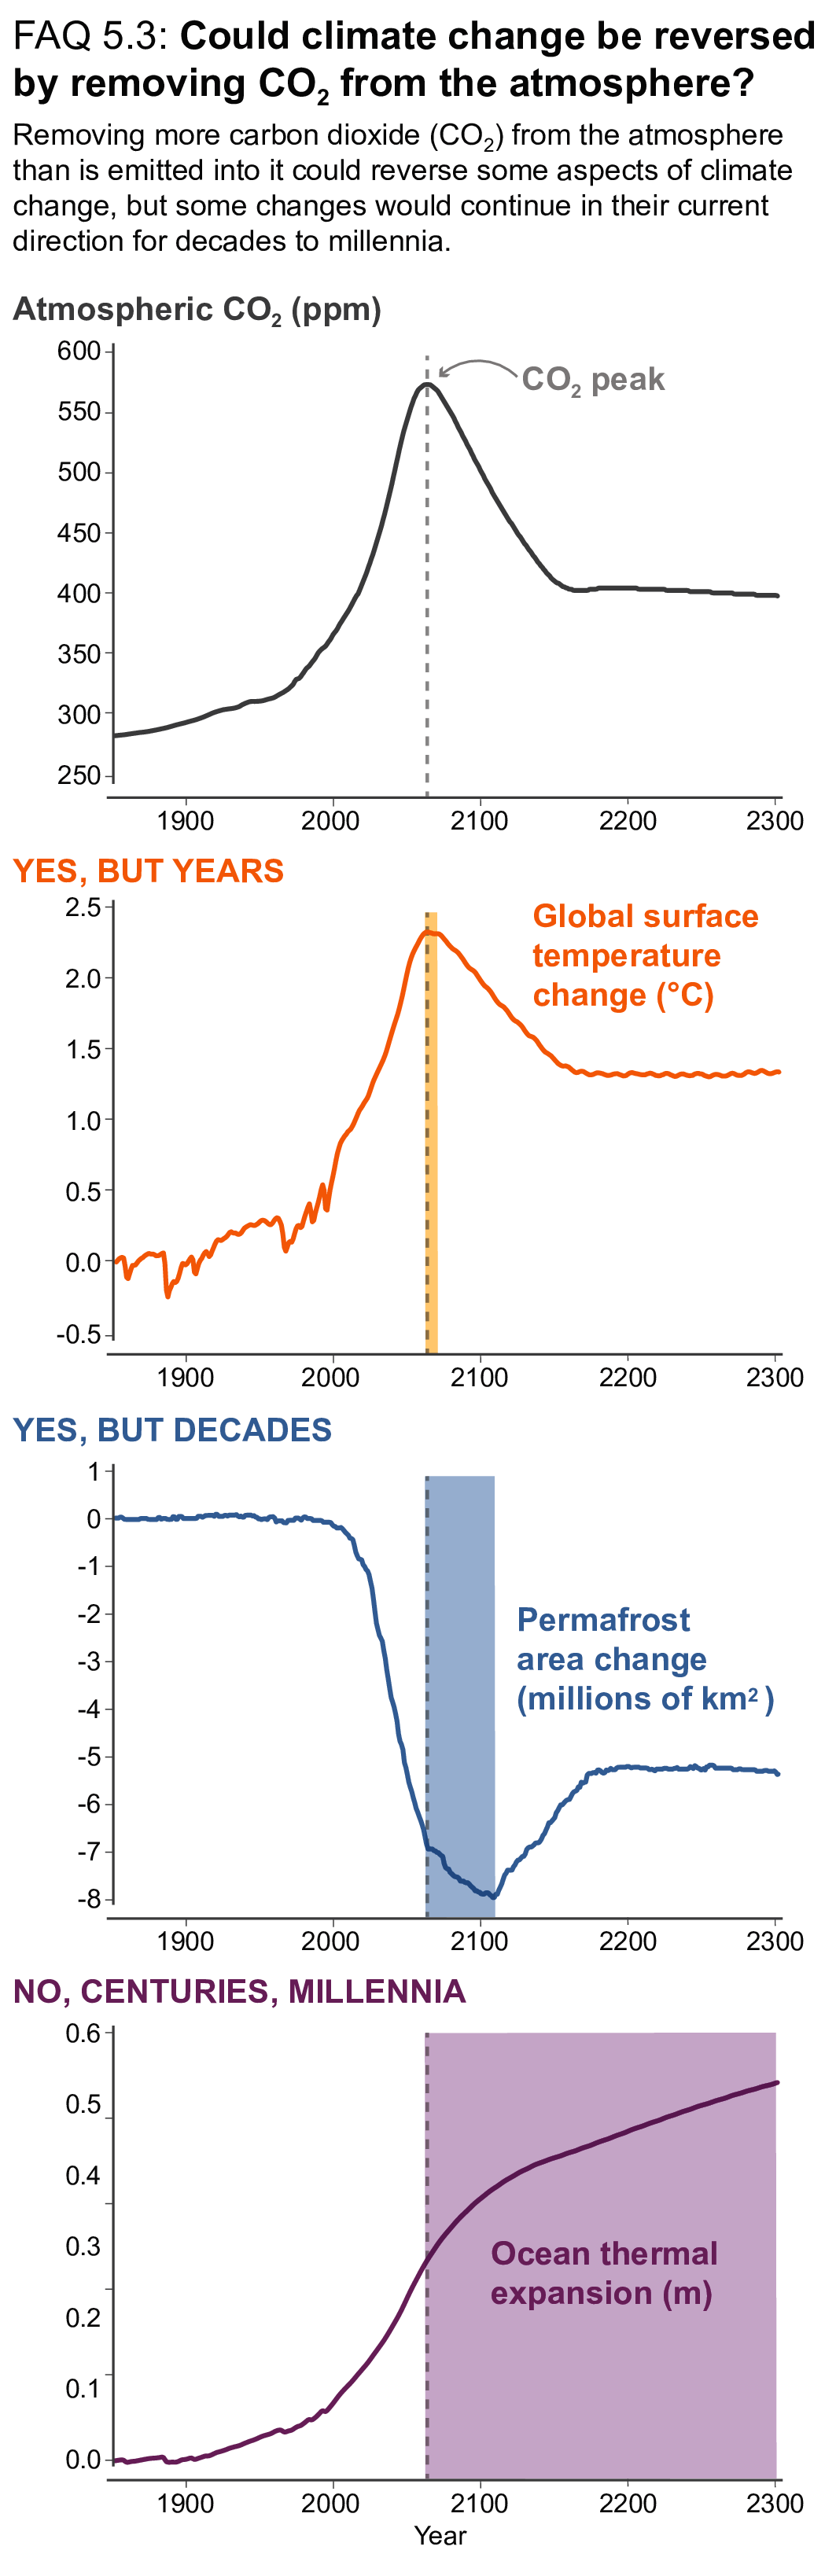
Figure caption
FAQ 5.3, Figure 1 | Changes in aspects of climate change in response to a peak and decline in the atmospheric CO2 concentration(top panel). The vertical grey dashed line indicates the time of peak CO2 concentration in all panels. It shows that the reversal of global surface warming lags the decrease in the atmospheric CO2 concentration by a few years, the reversal of permafrost area decline lags the decrease in atmospheric CO2 by decades, and ocean thermal expansion continues for several centuries. The quantitative information in the figure (i.e., numbers on vertical axes) is not to be emphasized as it results from simulations with just one model and will be different for other models. The qualitative behaviour, however, can be expected to be largely model independent.