Back chapter figures
Figure 5.10
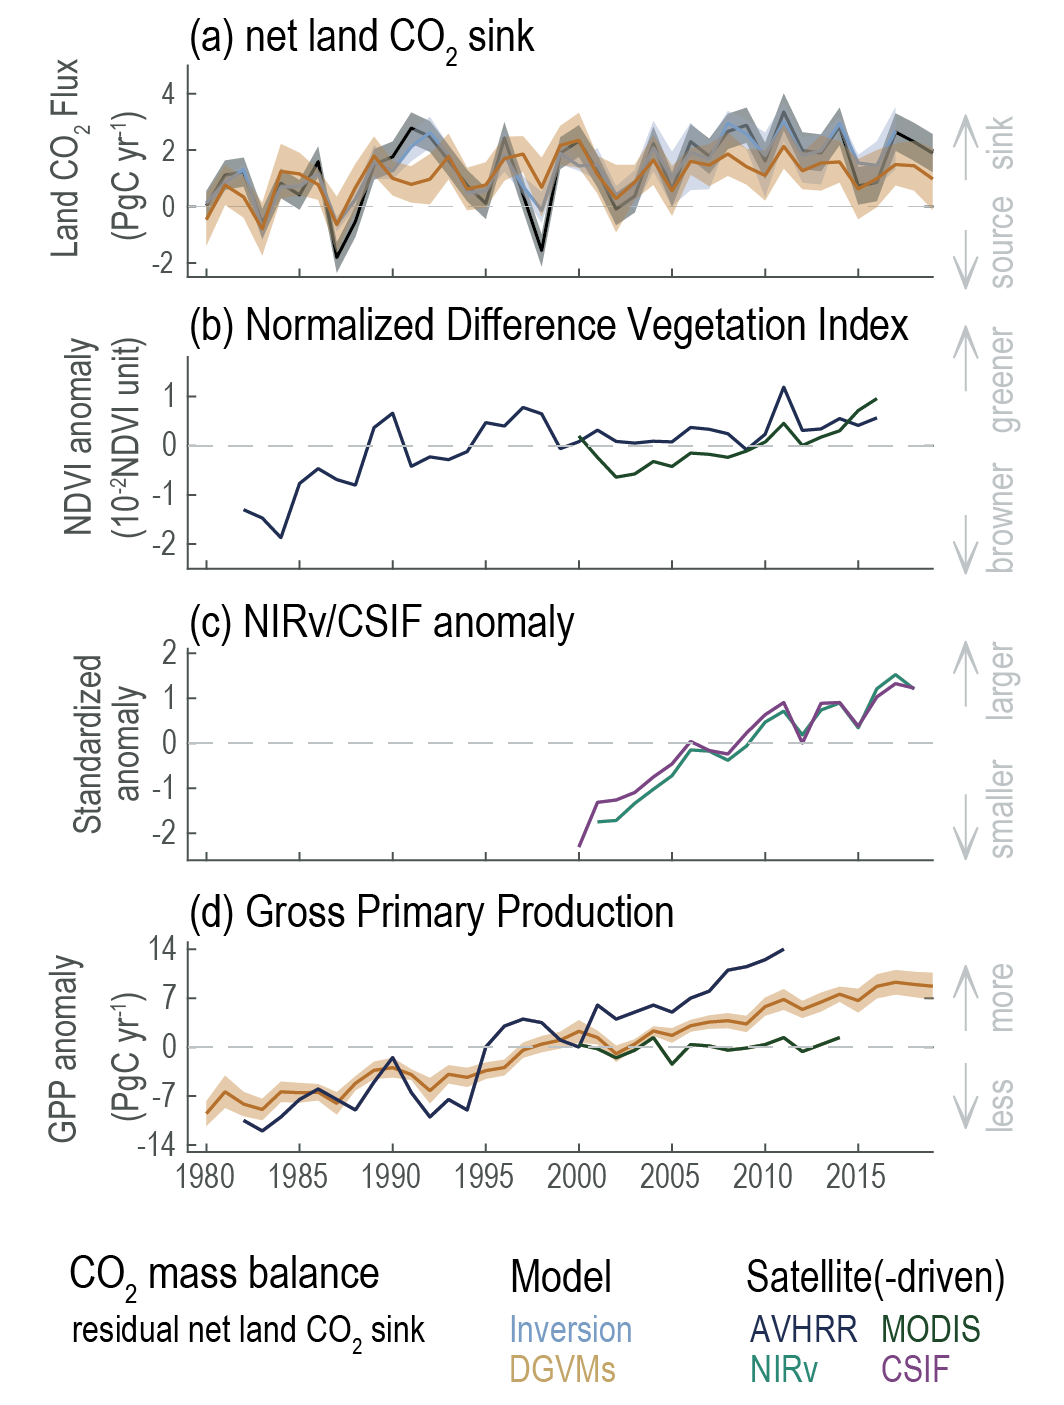
Figure caption
Figure 5.10 | Trends of the net land CO2 sink and related vegetation observations during 1980–2019. (a) Net land CO2 sink. The residual net land CO2 sink is estimated from the global CO2 mass balance (fossil fuel emissions minus atmospheric CO2 growth rate and ocean CO2 sink). Inversions indicate the net land CO2 sink estimated by an ensemble of four atmospheric inversions. Dynamic Global Vegetation Models (DGVMs) indicate the mean net land CO2 sink estimated by 17 dynamic global vegetation models driven by climate change, rising atmospheric CO2, land-use change and nitrogen deposition change (for carbon-nitrogen models). The positive values indicate net CO2 uptake from the atmosphere. (b) Normalized difference vegetation index (NDVI). The anomaly of global area-weighted NDVI observed by Advanced Very High Resolution Radiometer (AVHRR) and MODIS satellite sensors. AVHRR data are accessible during 1982–2016 and MODIS data are accessible during 2000–2018. (c) Near-infrared reflectance of vegetation (NIRv) and contiguous solar-induced chlorophyll fluorescence (CSIF). The standardized anomaly of area-weighted NIRv during 2001–2018 (Badgley et al., 2017) and CSIF during 2000–2018 (Zhang et al., 2018). (d) Gross primary production (GPP). The GPP from Cheng et al. (2017), DGVMs and MODIS GPP product (MOD17A3). GPP from Cheng et al. (2017) is based on an analytical model driven by climate change, rising atmospheric CO2, AVHRR leaf area index datasets and evapotranspiration datasets. GPP from DGVMs is the ensemble mean global GPP estimated by the same 17 DGVMs that provide the net land CO2 sink estimates. Shaded area indicates 1–σ inter-model spread except for atmospheric inversions, whose ranges were used due to limited number of models. Further details on data sources and processing are available in the chapter data table (Table 5.SM.6).