Back chapter figures
Figure 5.11
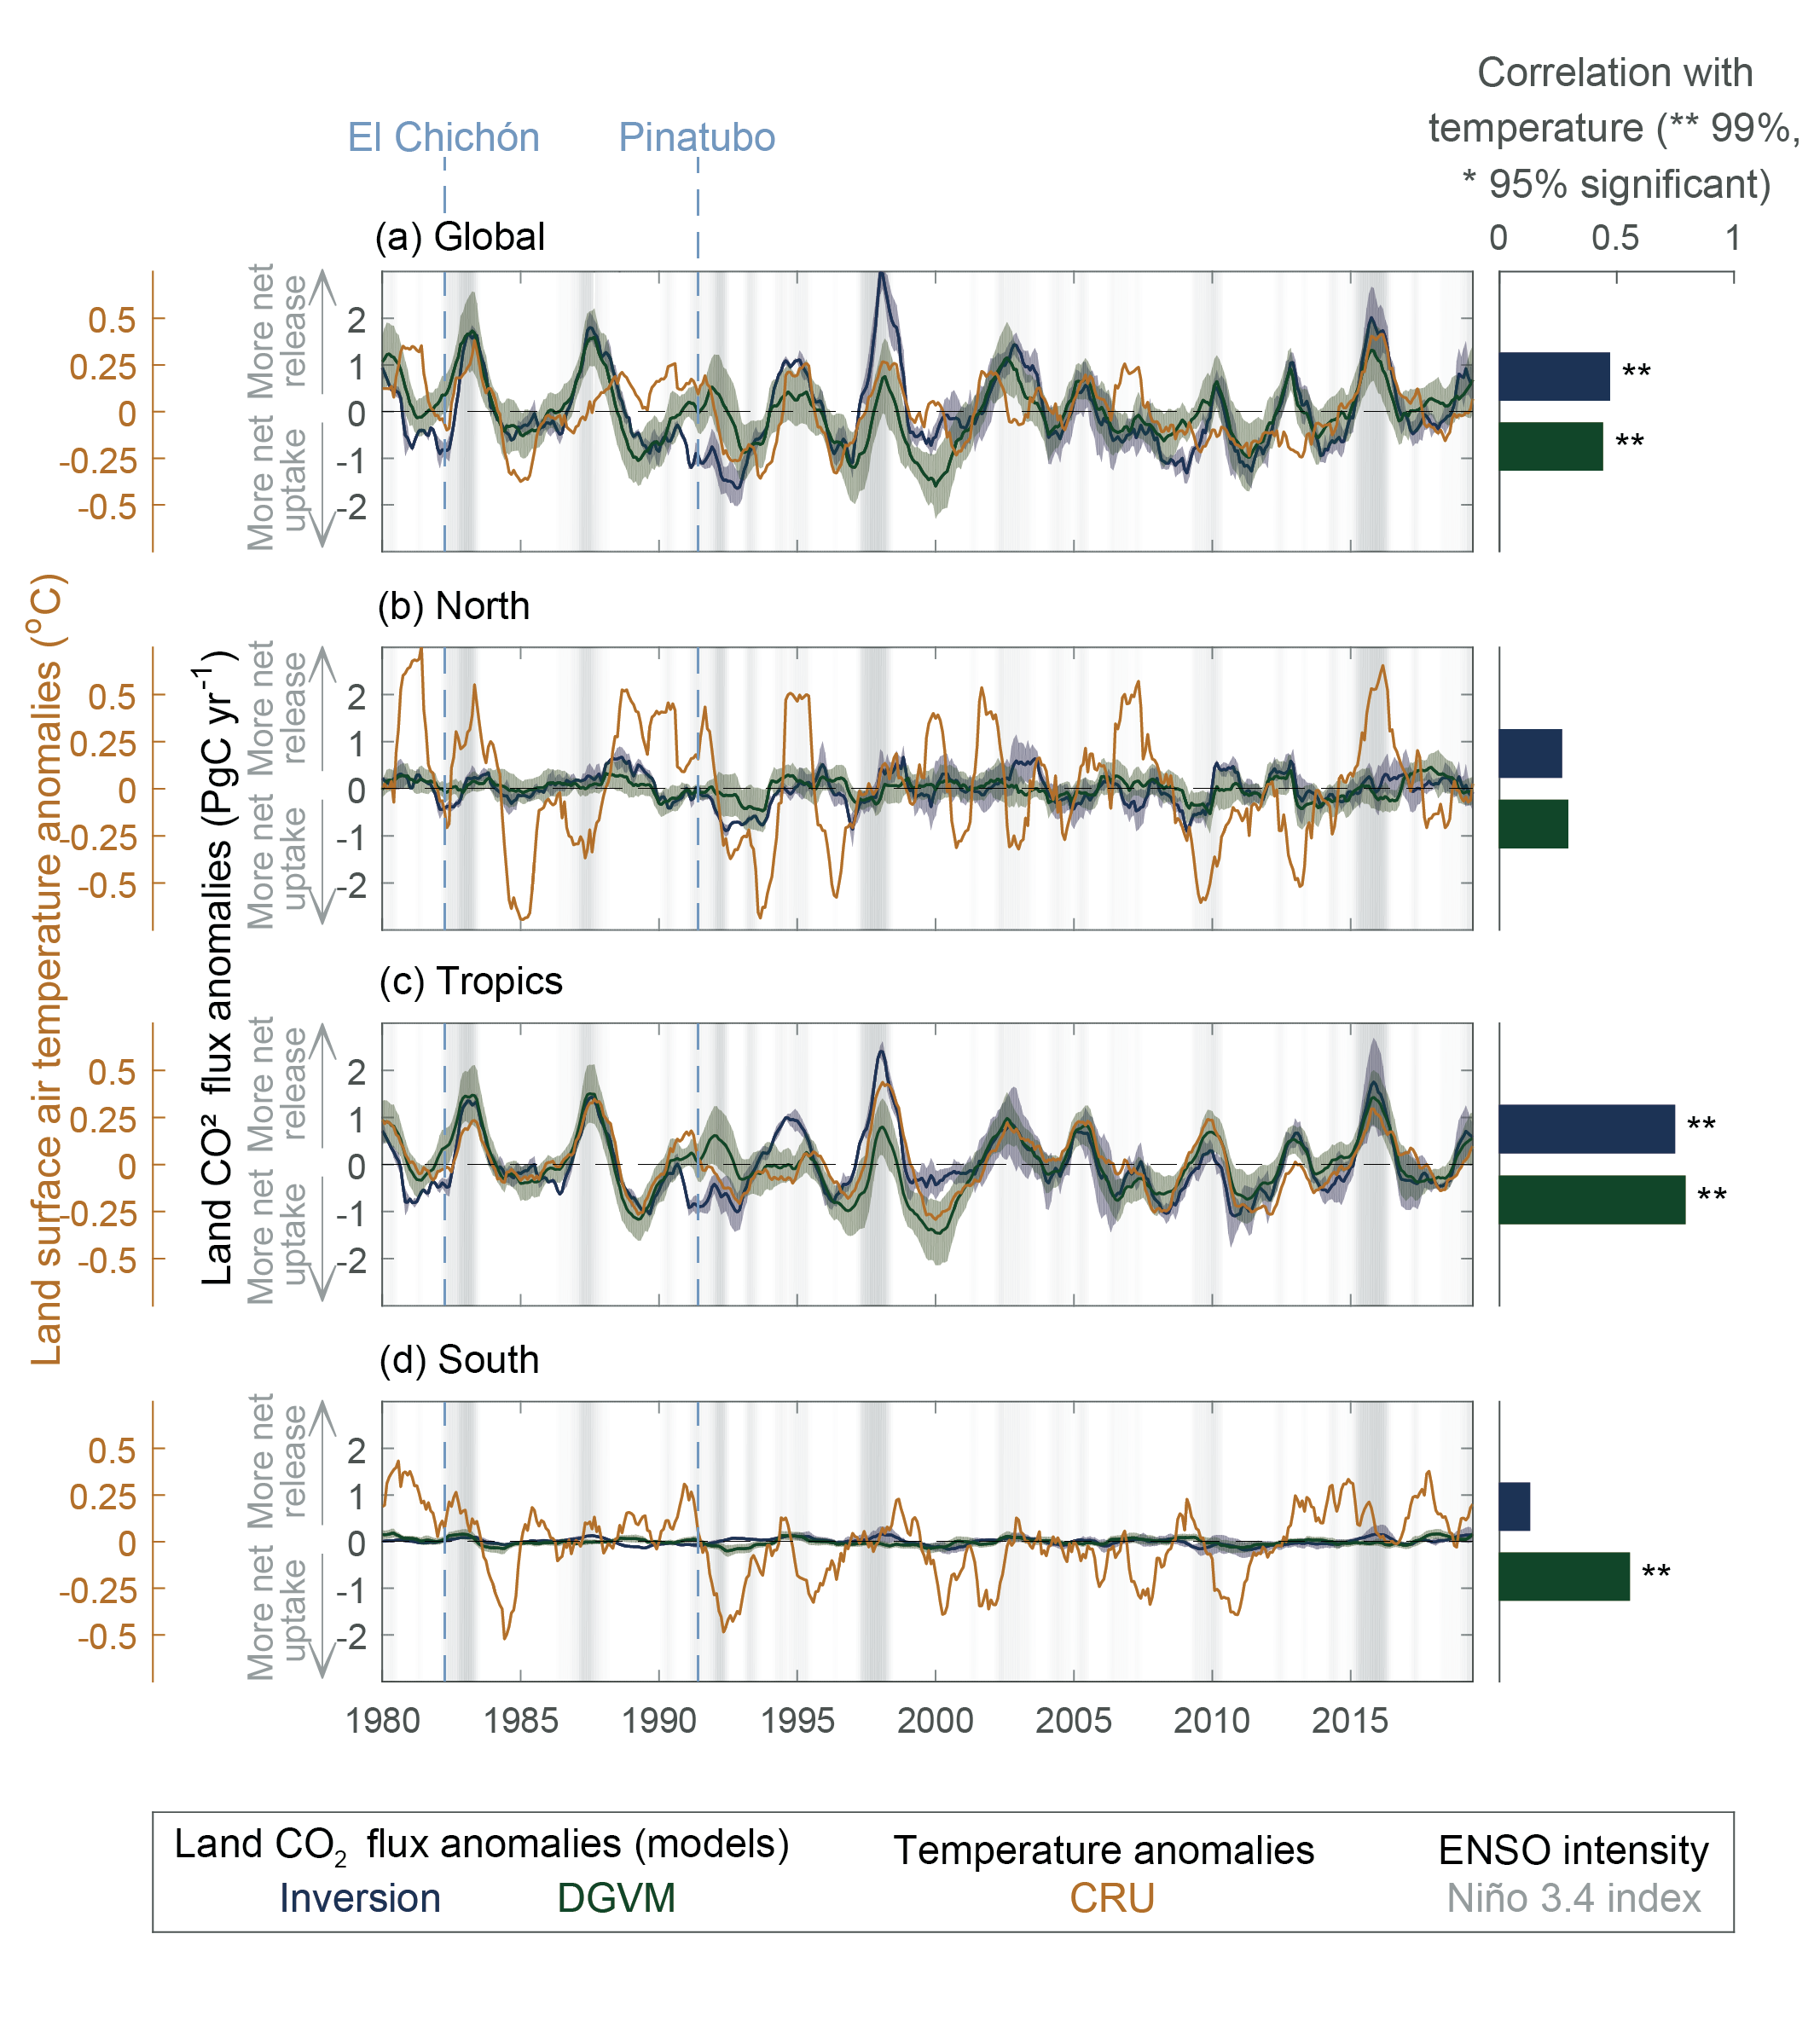
Figure caption
Figure 5.11 | Interannual variation in detrended anomalies of the net land CO2 sink and land surface air temperature during 1980–2019. Correlation coefficients between the net land CO2 sink anomalies and temperature anomalies are show on the right bar plots. The net land CO2 sink is estimated by four atmospheric inversions (blue) and 15 Dynamic Global Vegetation Models (DGVMs) (green), respectively (Friedlingstein et al., 2020). Solid blue and green lines show model mean detrended anomalies of the net land CO2 sink. The ensemble mean of DGVMs is bounded by the 1–σinter-model spread in each large latitude band (North 30°N–90°N, Tropics 30°S–30°N, South 90°S–30°S) and the globe. The ensemble mean of atmospheric inversions is bounded by model spread. For each latitudinal band, the anomalies of the net land CO2 sink and temperature (orange) were obtained by removing the long-term trend and seasonal cycle. A 12-month running mean was taken to reduce high-frequency noise. The bars in the right panels show correlation coefficients between the net land CO2 sink anomalies and temperature anomalies for each region. ** indicates P<0.01; * indicates P<0.05. The grey shaded area shows the intensity of El Niño–Southern Oscillation (ENSO) as defined by the Niño 3.4 index. Two volcanic eruptions (El Chichón and Mount Pinatubo) are indicated with light blue dashed lines. Temperature data are from the Climatic Research Unit (CRU), University of East Anglia (Harris et al., 2014). Anomalies were calculated following Patra et al. (2005), but using a 12-month low-pass filter and detrended to obtain interannual variations. Further details on data sources and processing are available in the chapter data table (Table 5.SM.6).