Back chapter figures
Figure 5.12
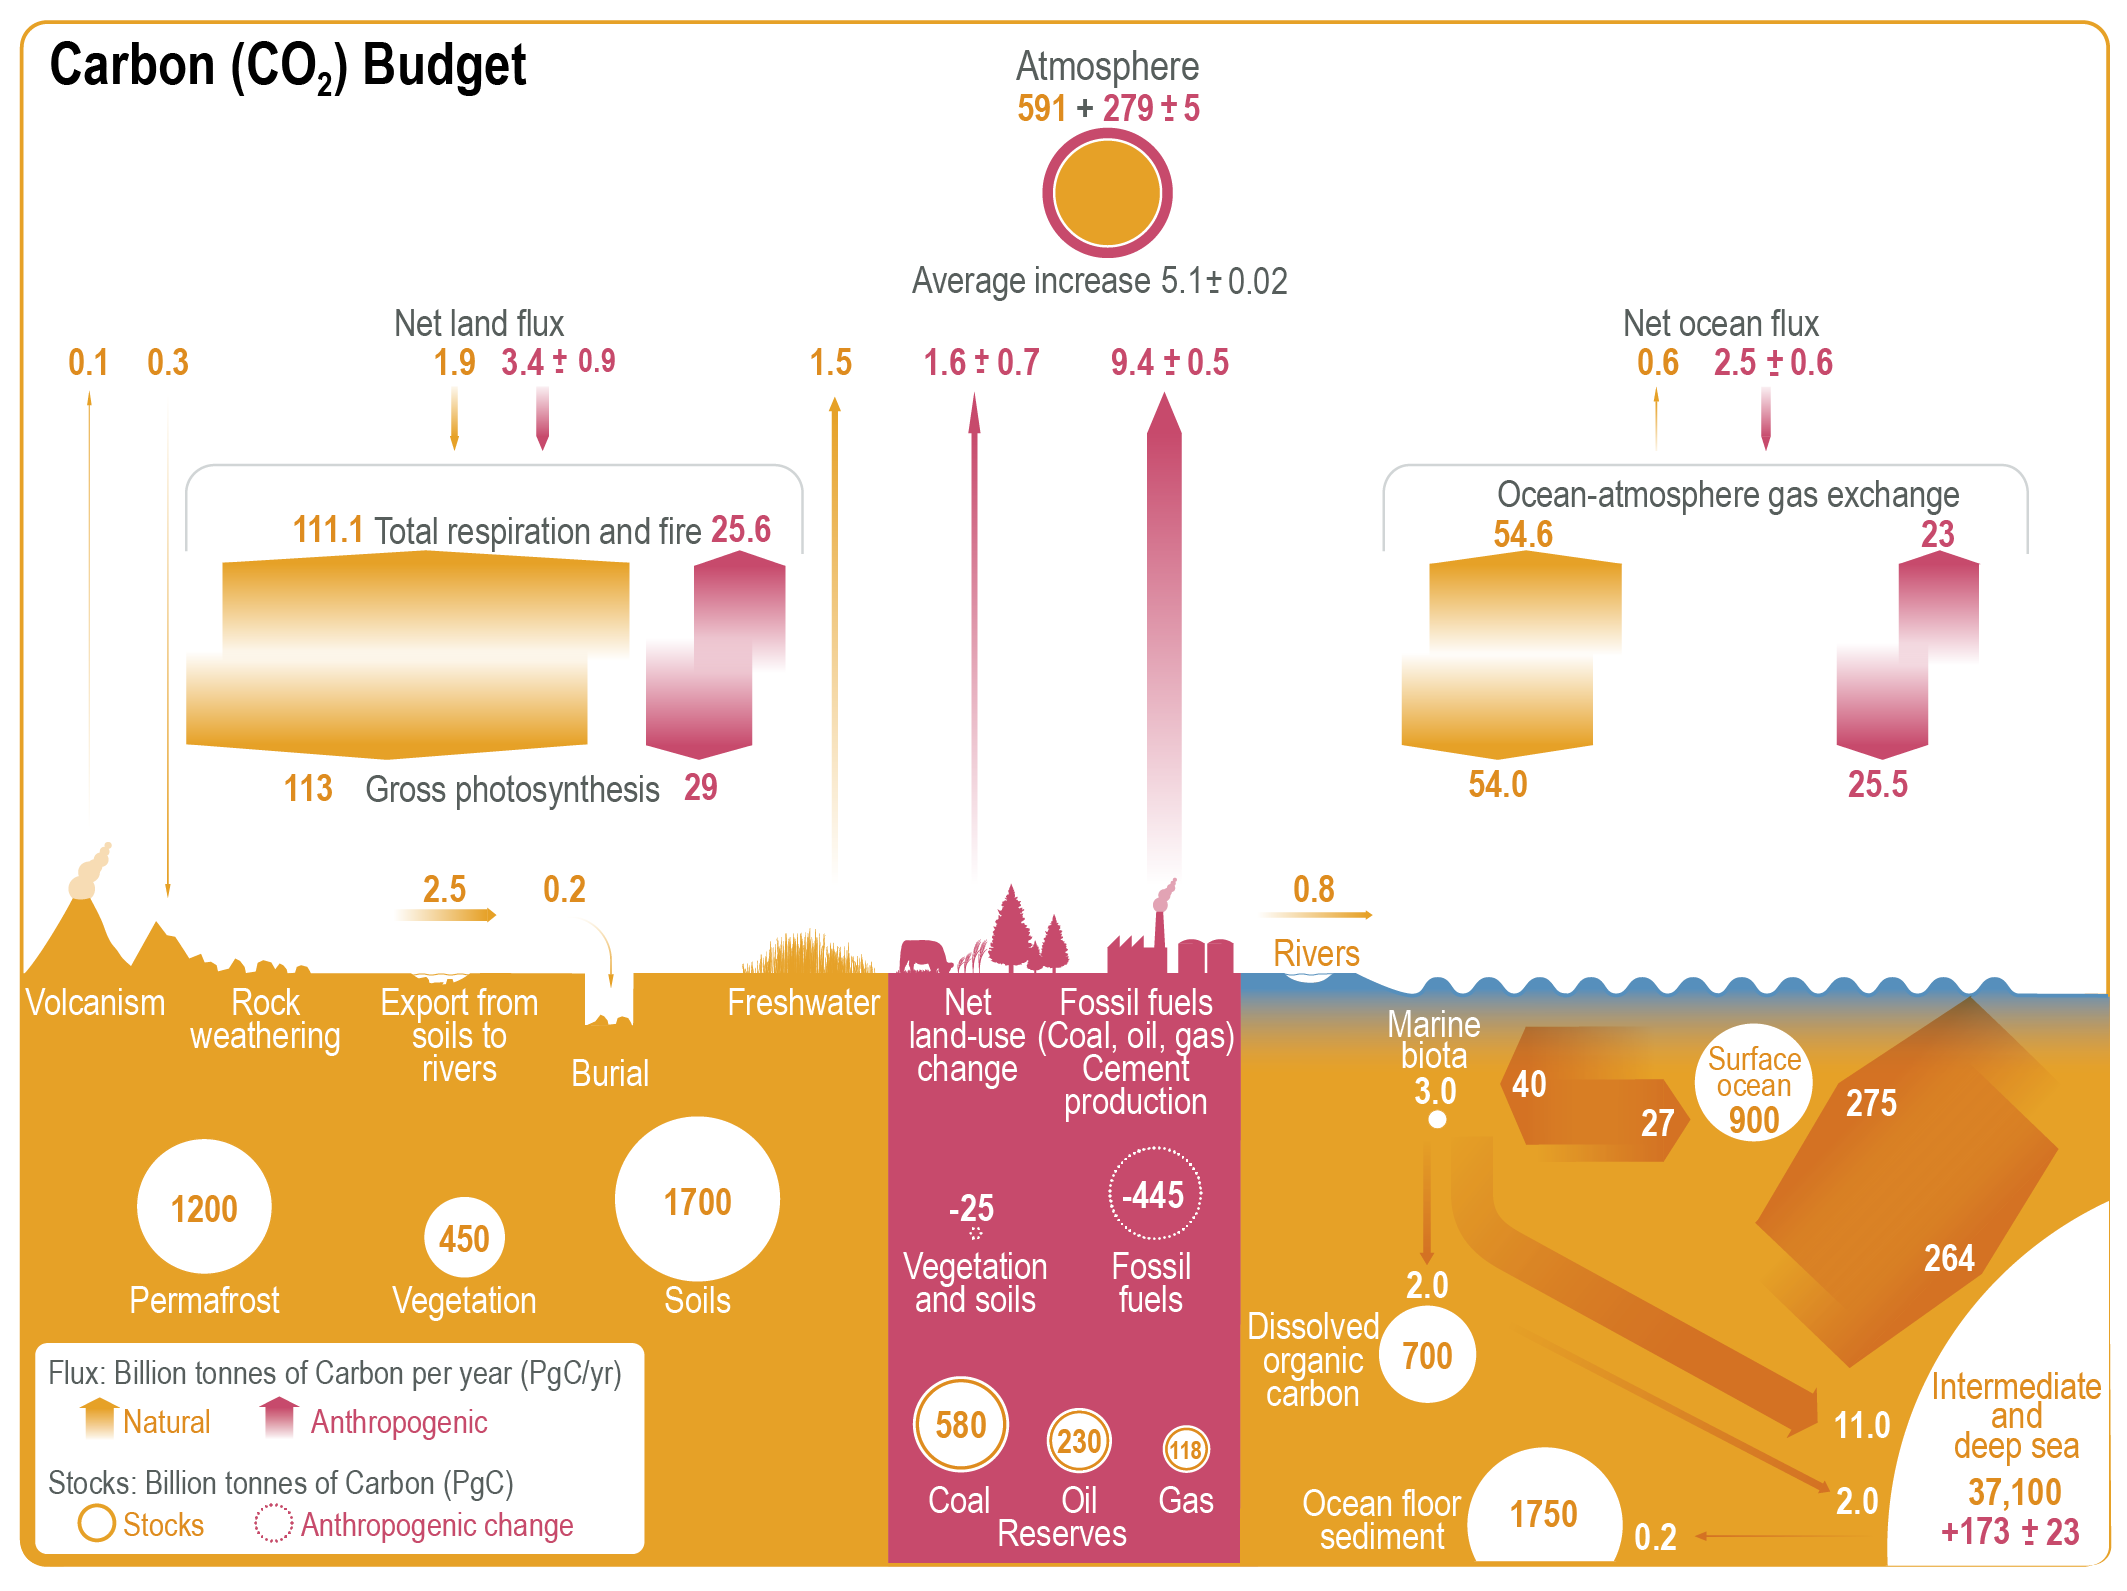
Figure caption
Figure 5.12 | Global carbon (CO2) budget (2010–2019). Yellow arrows represent annual carbon fluxes (in PgC yr–1) associated with the natural carbon cycle, estimated for the time prior to the industrial era, around 1750. Pink arrows represent anthropogenic fluxes averaged over the period 2010–2019. The rate of carbon accumulation in the atmosphere is equal to net land-use change emissions, including land management (called LULUCF in the main text) plus fossil fuel emissions, minus land and ocean net sinks (plus a small budget imbalance, Table 5.1). Circles with yellow numbers represent pre-industrial carbon stocks in PgC. Circles with pink numbers represent anthropogenic changes to these stocks (cumulative anthropogenic fluxes) since 1750. Anthropogenic net fluxes are reproduced from Friedlingstein et al. (2020). The relative change of gross photosynthesis since pre-industrial times is based on 15 DGVMs used in Friedlingstein et al. (2020). The corresponding emissions by total respiration and fire are those required to match the net land flux, exclusive of net land-use change emissions which are accounted for separately. The cumulative change of anthropogenic carbon in the terrestrial reservoir is the sum of carbon cumulatively lost by net land-use change emissions, and net carbon accumulated since 1750 in response to environmental drivers (warming, rising CO2, nitrogen deposition). The adjusted gross natural ocean–atmosphere CO2 flux was derived by rescaling the value in Figure 1 of Sarmiento and Gruber (2002) of 70 PgC yr–1by the revised estimate of the bomb radiocarbon (14C) inventory in the ocean. The original bomb14C inventory yielded an average global gas transfer velocity of 22 cm hr–1; the revised estimate is 17cm hr–1leading to 17/22*70=54. Dissolved organic carbon reservoir and fluxes from Hansell et al. (2009). Dissolved inorganic carbon exchanges between surface and deep ocean, subduction and obduction from Levy et al. (2013). Export production and flux from (Boyd et al., 2019). Net primary production (NPP) and remineralization in surface layer of the ocean from Kwiatkowski et al. (2020); Séférian et al. (2020). Deep ocean reservoir from Keppler et al. (2020). Anthropogenic carbon reservoir in the ocean is from Gruber et al. (2019b) extrapolated to 2015. Fossil fuel reserves are from BGR (2020); fossil fuel resources are 11,490 PgC for coal, 6,780 PgC for oil and 365 PgC for natural gas. Permafrost region stores are from Hugelius et al. (2014); Strauss et al. (2017); Mishra et al. (2021) (see also Box 5.1) and soil carbon stocks outside of permafrost region from Batjes (2016); Jackson et al. (2017). Biomass stocks (range of seven estimates) are from Erb et al. (2018). Sources for the fluxes of the land–ocean continuum are provided in main text and adjusted within the ranges of the various assessment to balance the budget Section 5.2.1.5).