Back chapter figures
Figure 5.13
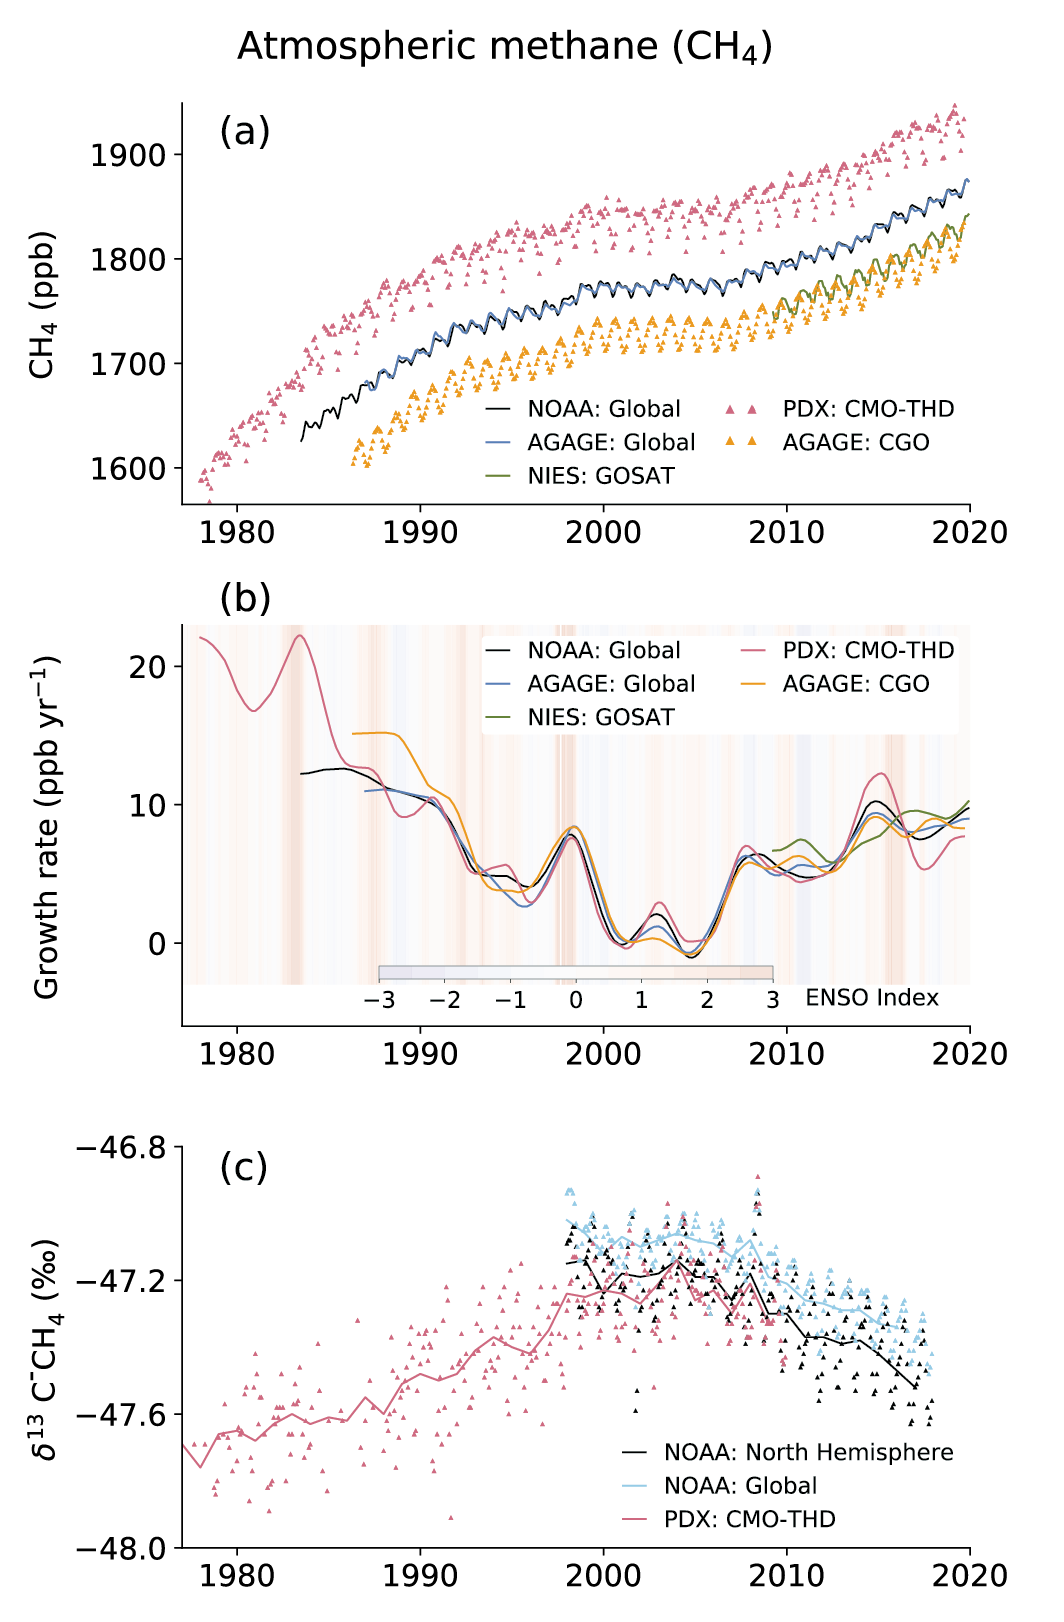
Figure caption
Figure 5.13 | Time series of CH4 concentrations, growth rates and isotopic composition. (a) CH4 concentrations; (b) CH4 growth rates; (c) d13-CH4. Data from selected site networks operated by the National Oceanic and Atmospheric Administration (NOAA; Dlugokencky et al., 2003), Advanced Global Atmospheric Gases Experiment (AGAGE; Prinn et al., 2018) and Portland Airport (PDX, Portland State University; Rice et al., 2016). To maintain clarity, data from many other measurement networks are not included here, and all measurements are shown in the World Metereological Organization X2004ACH4 global calibration standard. Global mean values of XCH4 (total-column), retrieved from radiation spectra measured by the Greenhouse Gases Observing Satellite (GOSAT) are shown in panels (a) and (b). Cape Grim Observatory (CGO; 41°S, 145°E) and Trinidad Head (THD; 41°N, 124°W) data are taken from the AGAGE network. NOAA global and northern hemispheric (NH) means for d13C are calculated from 10 and 6 sites, respectively. The PDX data adjusted to NH (period: 1977–2000) are merged with THD (period: 2001–2019) for CH4 concentration and growth rate analysis, and PDX and NOAA NH means of d13C data are used for joint interpretation of long-term trends analysis. The multivariate El Niño–Southern Oscillation (ENSO) index (MEI) is shown in panel (b). Further details on data sources and processing are available in the chapter data table (Table 5.SM.6).