Back chapter figures
Figure 5.15
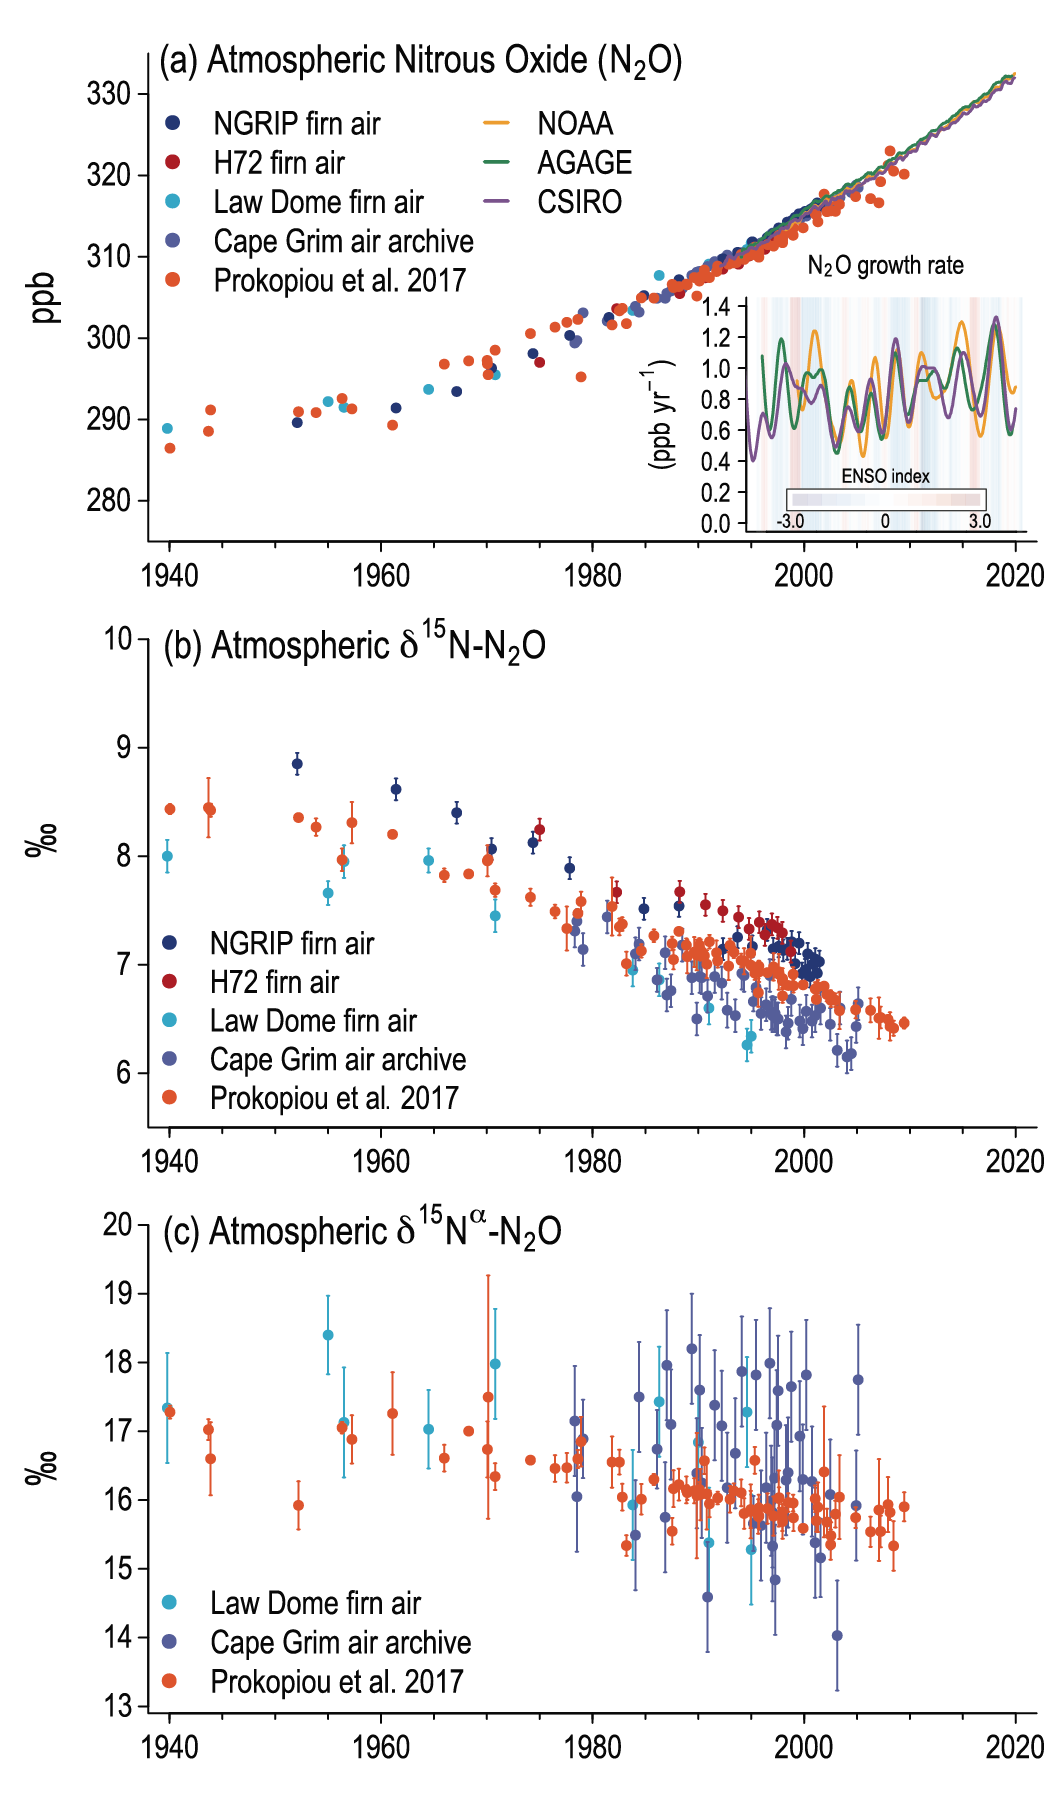
Figure caption
Figure 5.15 | Changes in atmospheric nitrous oxide (N2O) and its isotopic composit ion since 1940. (a) Atmospheric N2O abundance (parts per billion, ppb) and growth rat (ppb yr–1); (b) δ15N of atmospheric N2O; and (c) alpha-site15N–N2O. Estimates are based on direct atmospheric measurements in the Advanced Global Atmospheric Gases Experiment (AGAGE), Commonwealth Scientific and Industrial Research Organisation (CSIRO), and National Oceanic and Atmospheric Administration (NOAA) networks (Prinn et al., 2000, 2018; Francey et al., 2003; Hall et al., 2007; Elkins et al., 2018), archived air samples from Cape Grim, Australia (Park et al., 2012), and firn air from the North Greenland Ice Core Project (NGRIP) Greenland and H72 Antarctica (Ishijima et al., 2007), Law Dome Antarctica (Park et al., 2012), as well as a collection of firn ice samples from Greenland (Prokopiou et al., 2017, 2018). Shading in (a) is based on the multivariate El Niño–Southern Oscillation (ENSO) index, with red indicating El Niño conditions (Wolter and Timlin, 1998). Further details on data sources and processing are available in the chapter data table (Table 5.SM.6).