Back chapter figures
Figure 5.19
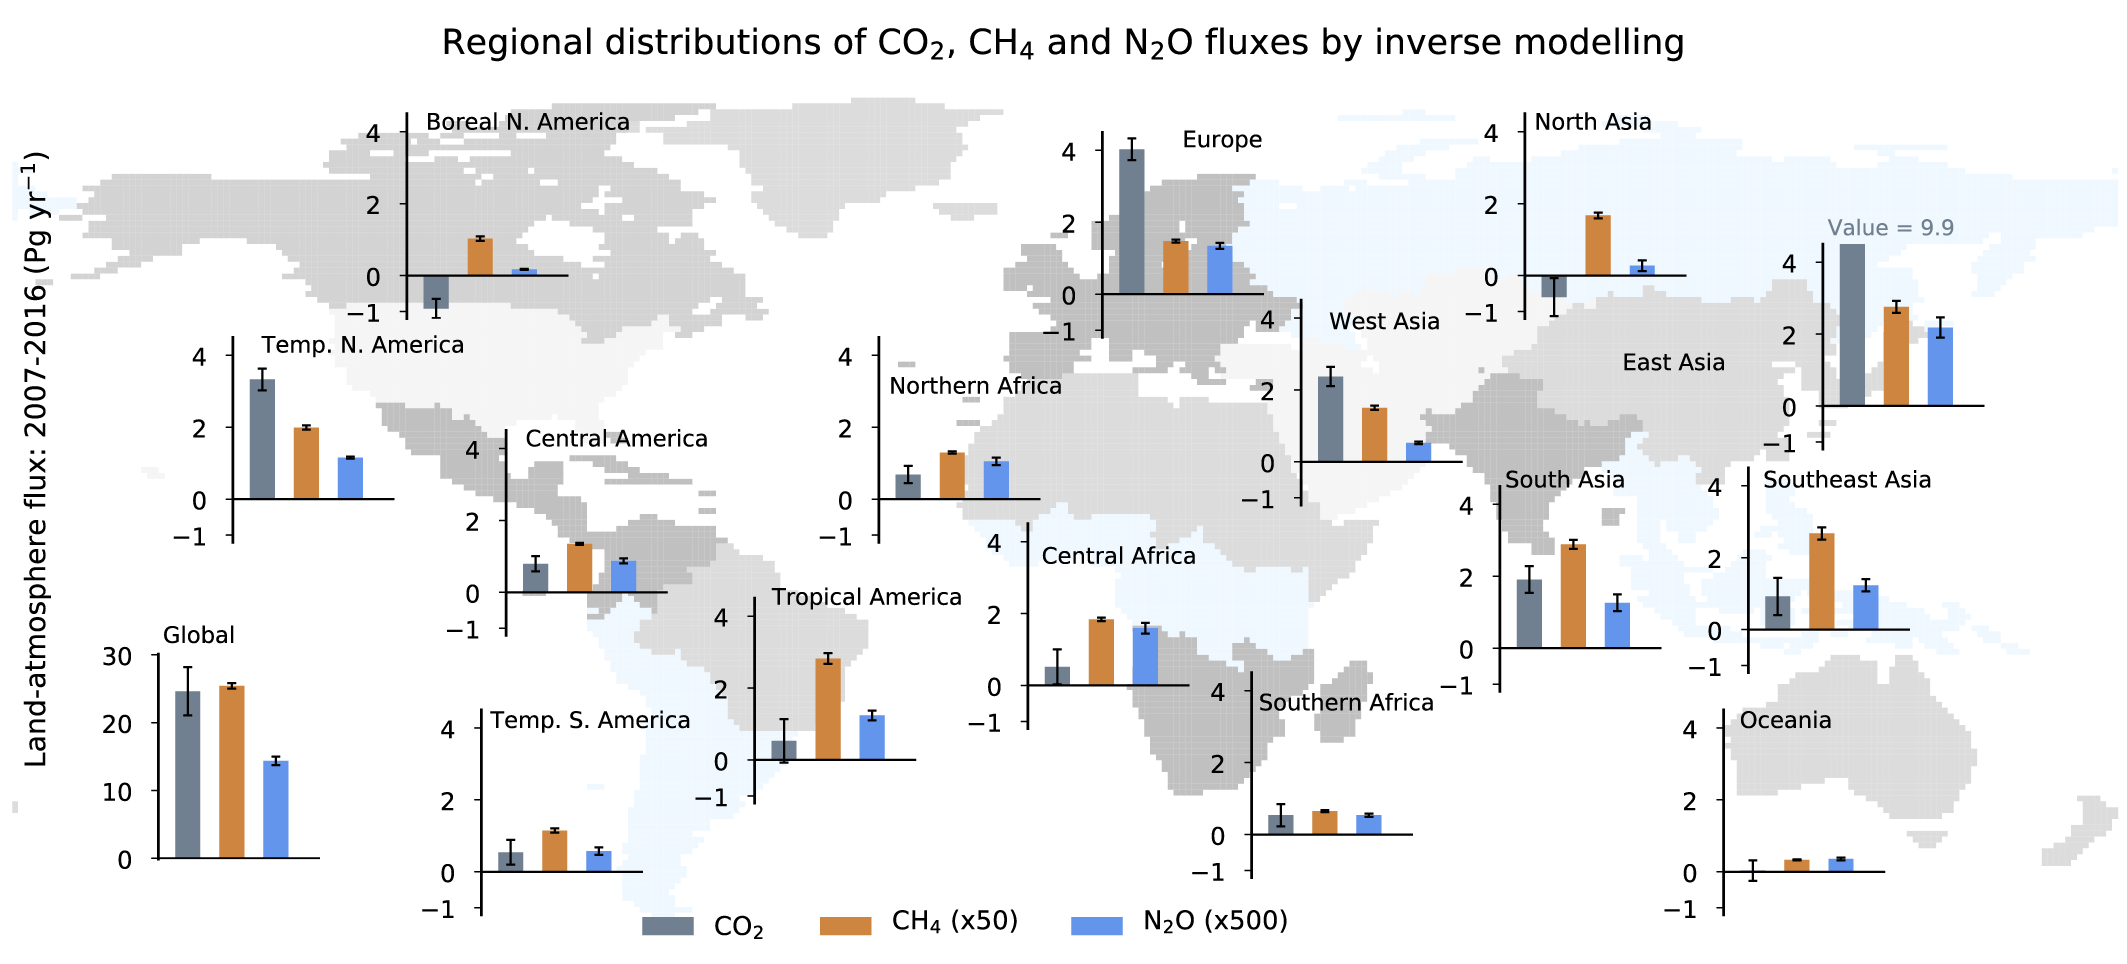
Figure caption
Figure 5.19 | Regional distributions of net fluxes of carbon dioxide (CO2), methane (CH4), nitrous oxide (N2O) on the Earth’s surface. The region divisions, shown as the shaded map, are made based on ecoclimatic characteristics of the land. The fluxes include those from anthropogenic activities and natural causes that result from responses to anthropogenic greenhouse gases and climate change (feedbacks) as in the three budgets shown in Sections 5.2.1.5, 5.2.2.5, and 5.2.3.5. The CH4and N2O emissions are weighted by arbitrary factors of 50 and 500, respectively, for depiction by common y-axes. Fluxes are shown as the mean of the inverse models as available from Thompsonet al. (2019); Friedlingsteinet al. (2020); Saunoiset al. (2020). Further details on data sources and processing are available in the chapter data Table (Table 5.SM.6).