Back chapter figures
Figure 5.20
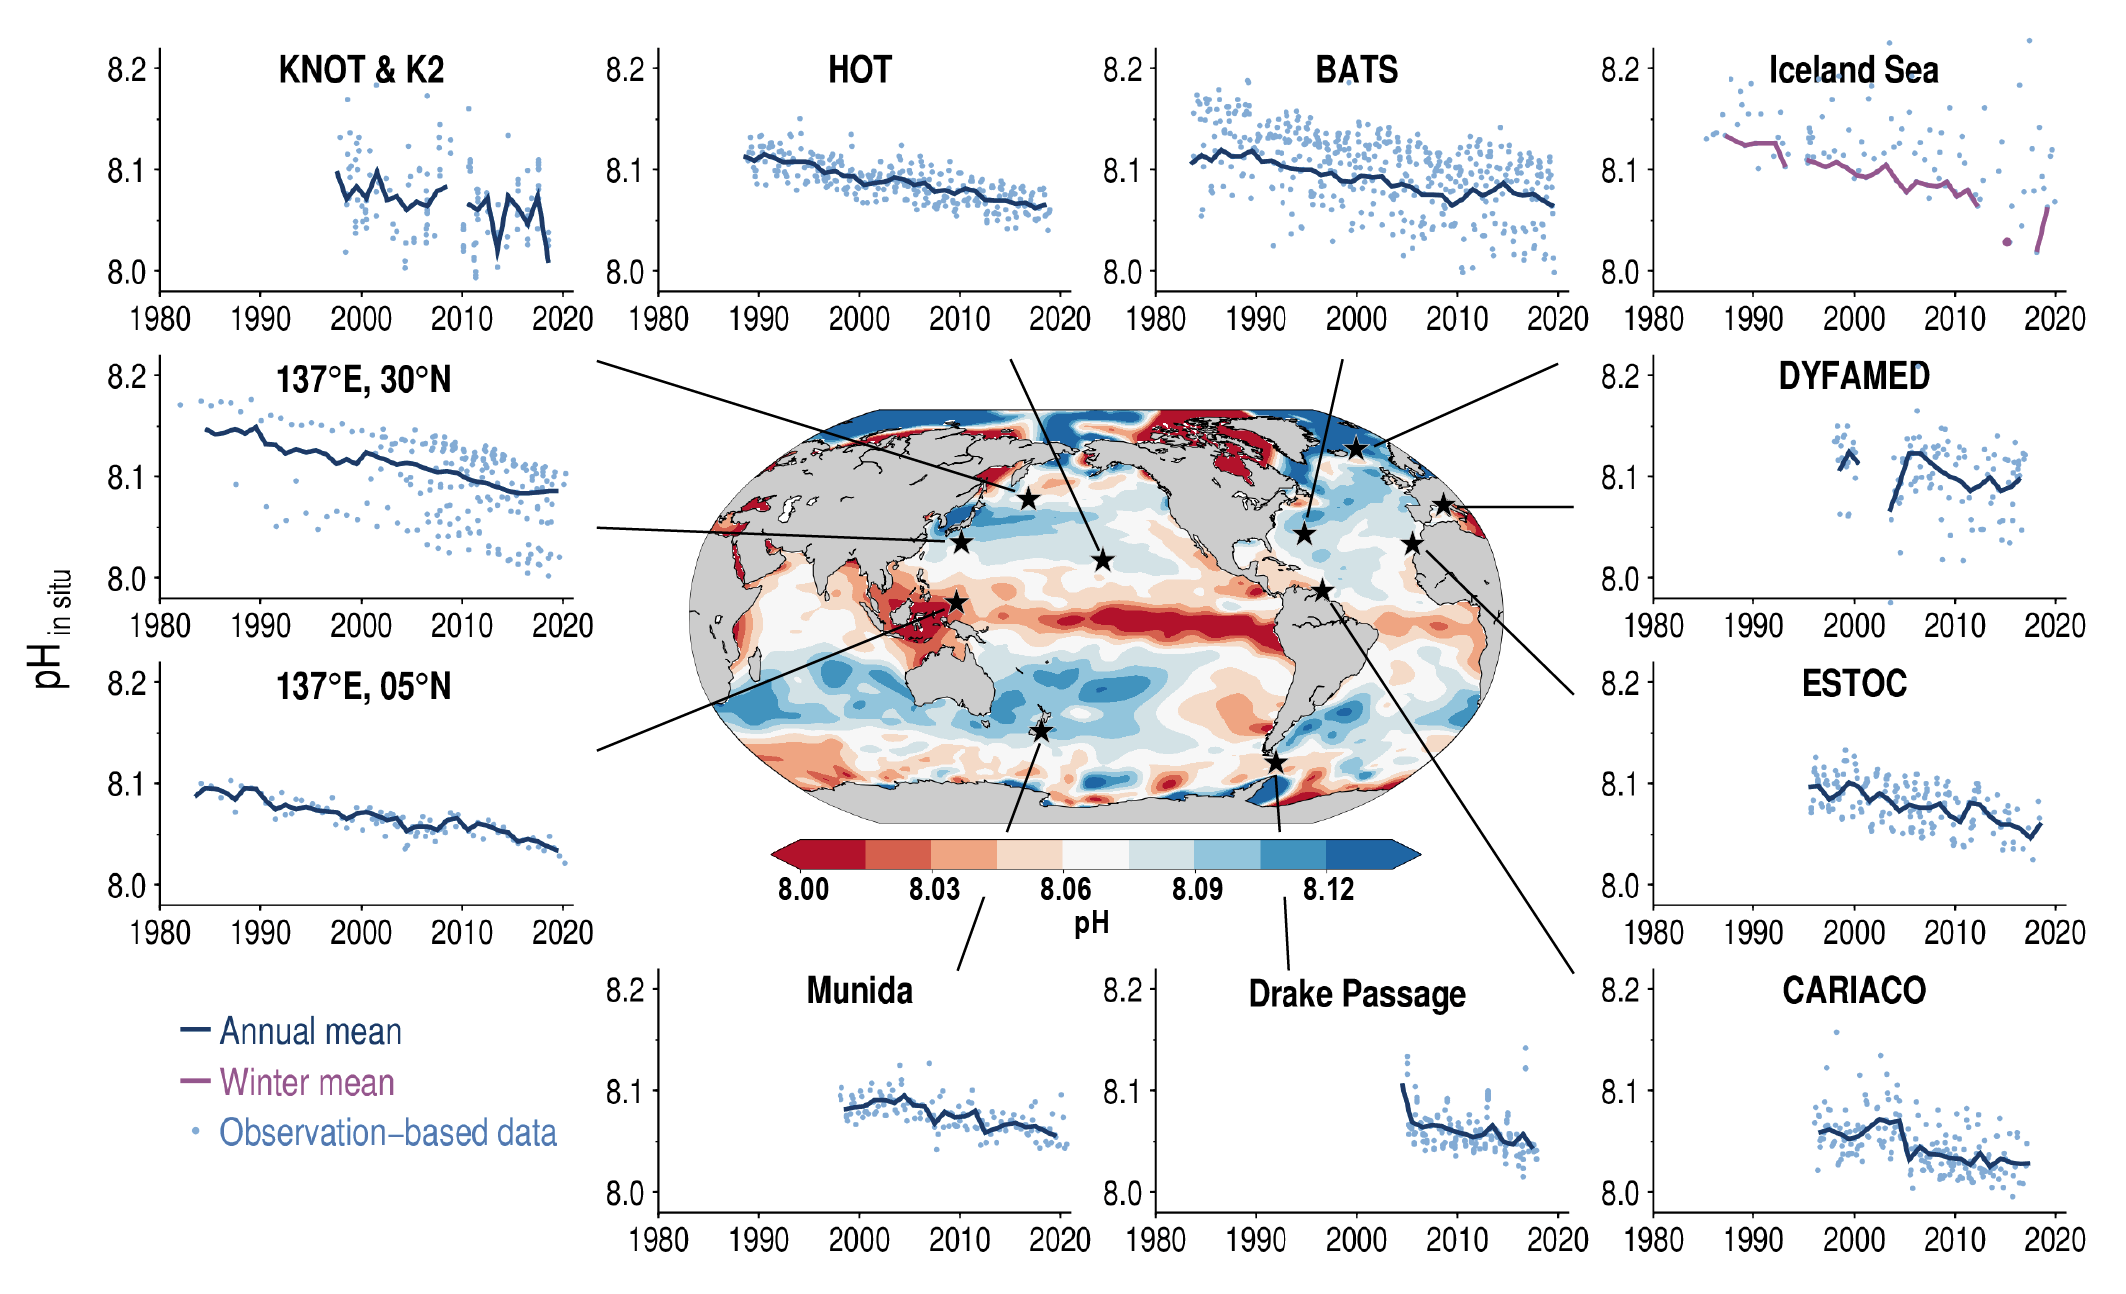
Figure caption
Figure 5.20 | Multi-decadal trends of pH (Total Scale) in surface layer at various sites of the oceans and a global distribution of annual mean pH adjusted to the year 2000. Time-series data of pH are from Dore et al. (2009), Olafsson et al. (2009), González-Dávila et al. (2010), Bates et al. (2014), Takahashi et al. (2014), Wakita et al. (2017), Merlivat et al. (2018), Ono et al. (2019), and Bates and Johnson (2020). Global distribution of annual mean pH have been evaluated from data of surface oceanpCO2 measurements (Bakker et al., 2016; Jiang et al., 2019). Acronyms in panels: KNOT and K2 – Western Pacific subarctic gyre time series; HOT – Hawaii Ocean Time-series; BATS – Bermuda Atlantic Time-series Study; DYFAMED – Dynamics of Atmospheric Fluxes in the Mediterranean Sea; ESTOC – European Station for Time-series in the Ocean Canary Islands; CARIACO – Carbon Retention in a Colored Ocean Time-series. Further details on data sources and processing are available in the chapter data table (Table 5.SM.6).