Back chapter figures
Figure 5.21
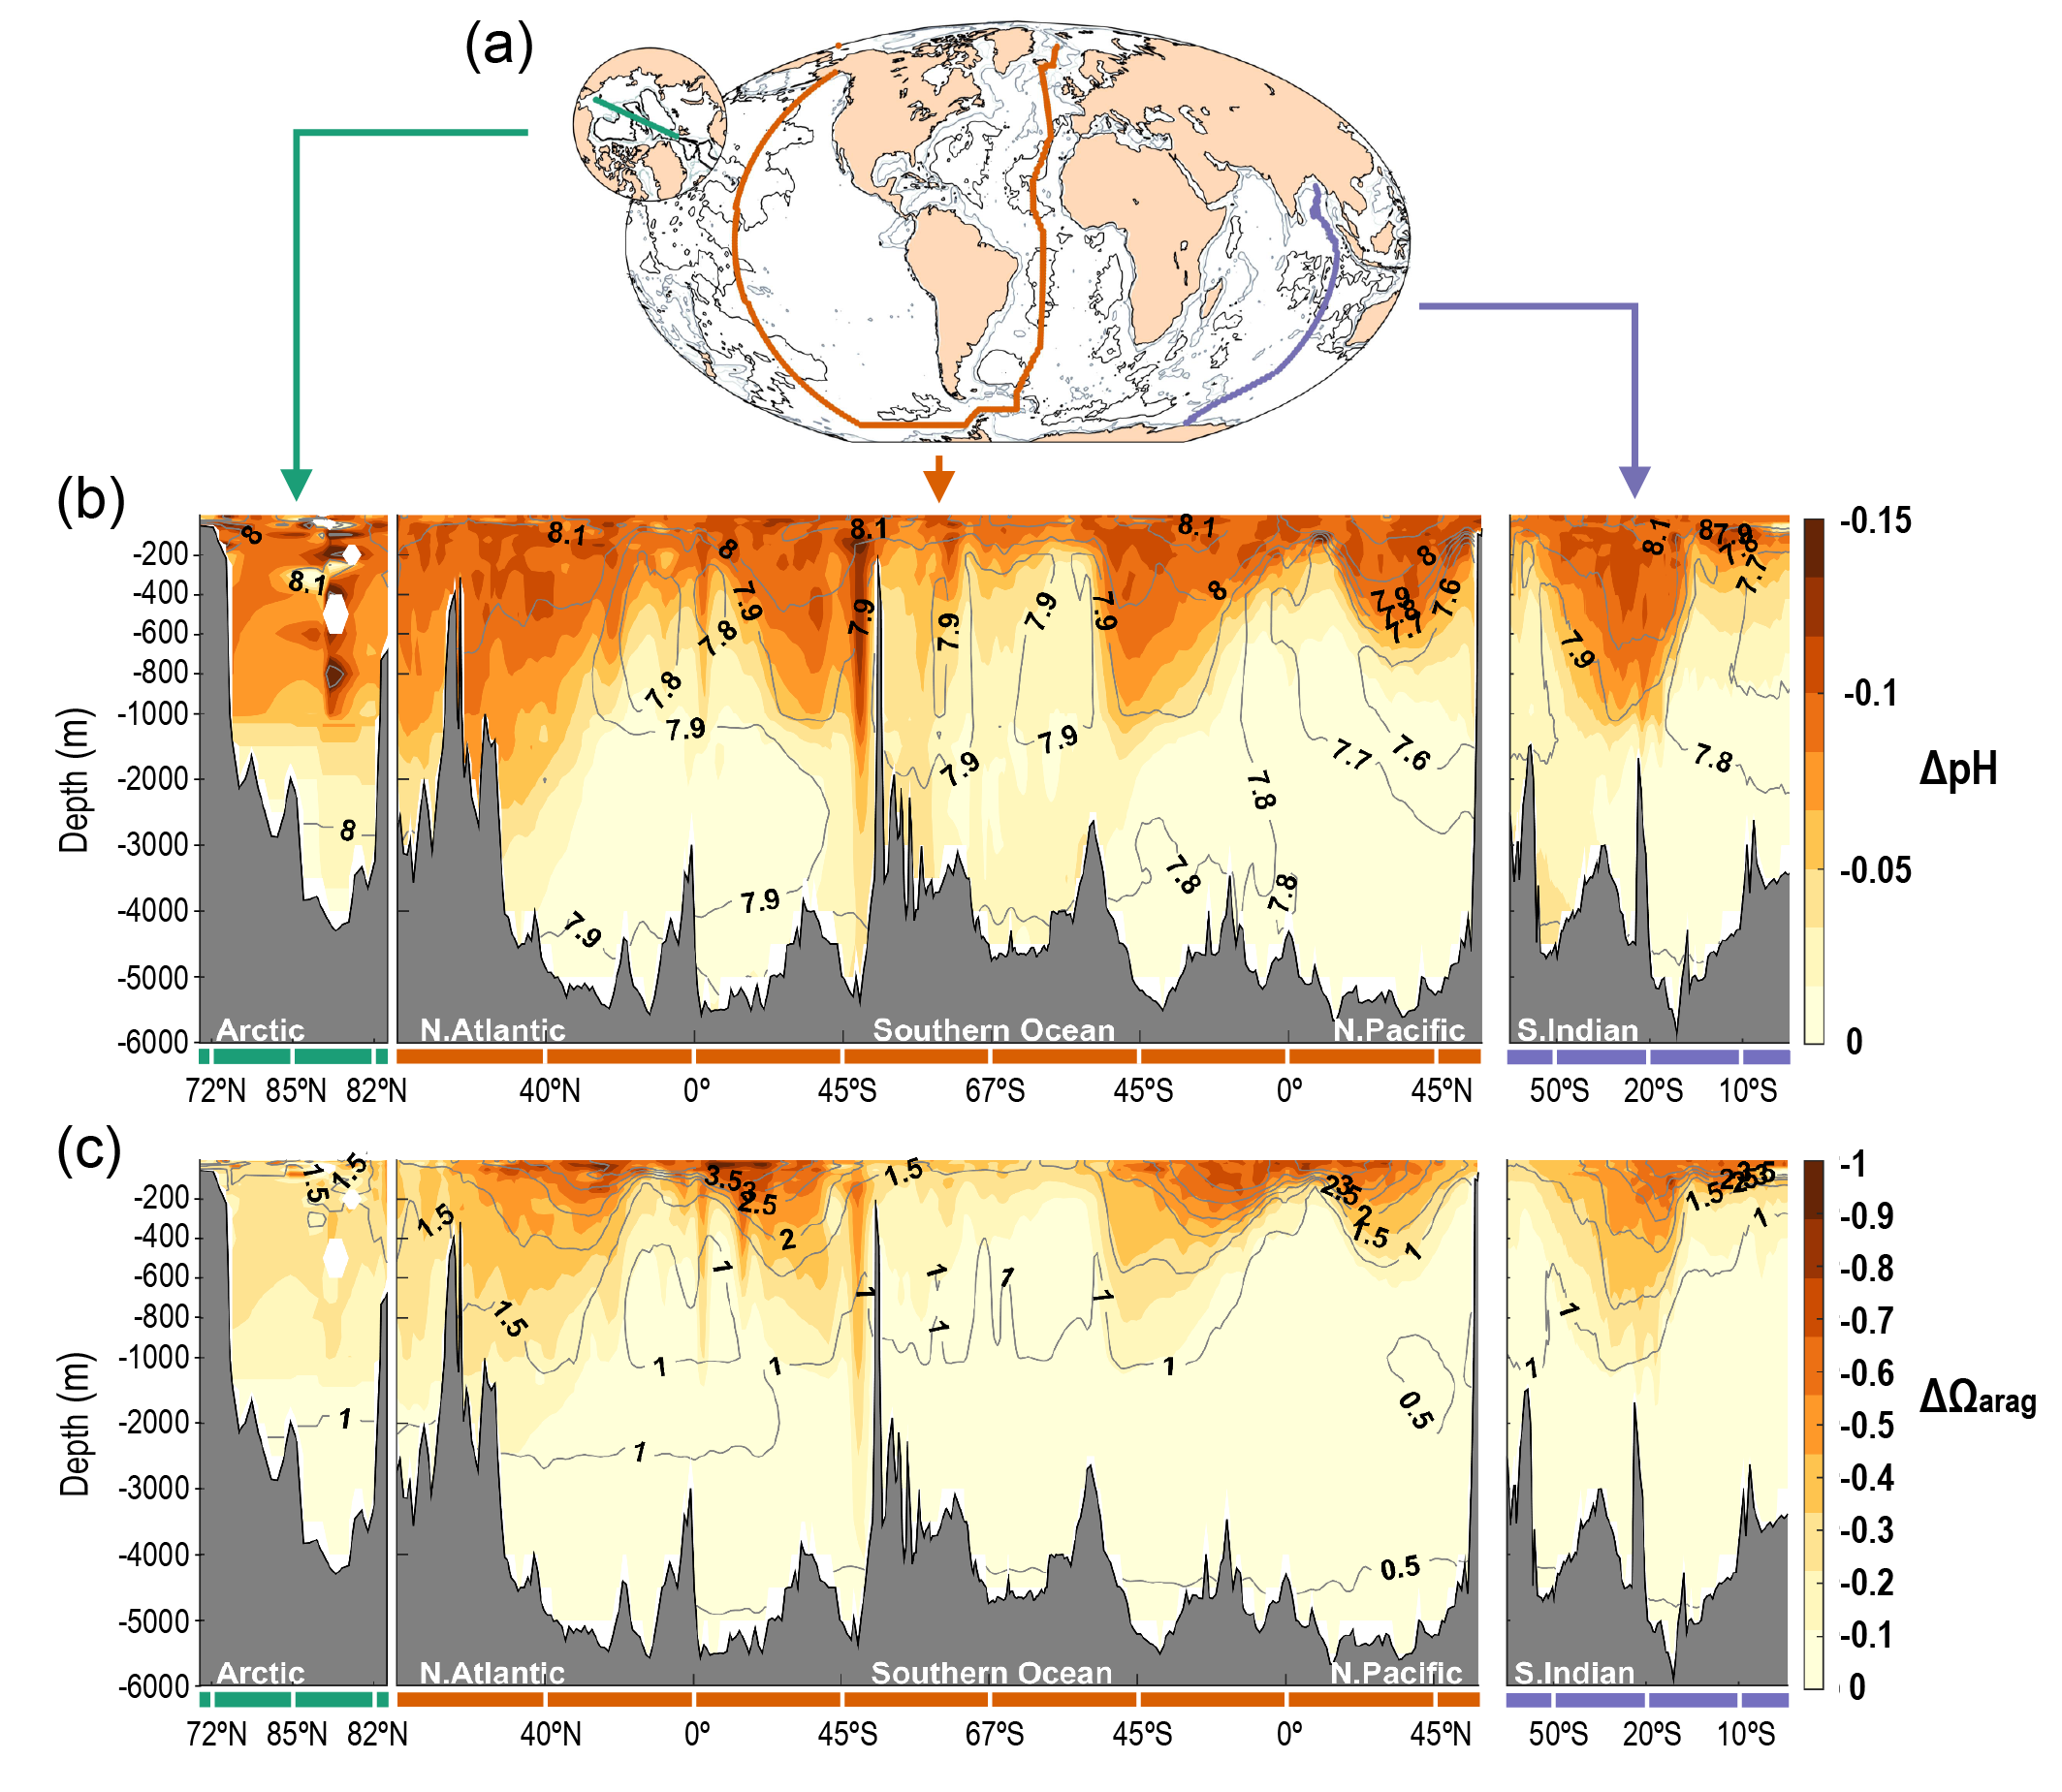
Figure caption
Figure 5.21 | Spread of ocean acidification from the surface into the interior of ocean since pre-industrial times. (a) Map showing the three transects used to create the cross sections shown in (b) and (c); vertical sections of the changes in (b) pH and (c) saturation state of aragonite (Ωarag) between 1800–2002 due to anthropogenic CO2 invasion (colour). Contour lines are their contemporary values in 2002. The red transect begins in the Nordic Seas and then follows the GO-SHIP lines A16 southward in the Atlantic Ocean, SR04 and S04P westward in the Southern Ocean, and P16 northward in the Pacific Ocean. The purple line follows the GO-SHIP line I09 southward in the Indian Ocean. The green line on the smaller inset crosses the Arctic Ocean from the Bering Strait to North Pole along 175°W and from the North Pole to the Fram Strait along 5°E (Lauvset et al., 2020). Further details on data sources and processing are available in the chapter data table (Table 5.SM.6).