Back chapter figures
Figure 5.24
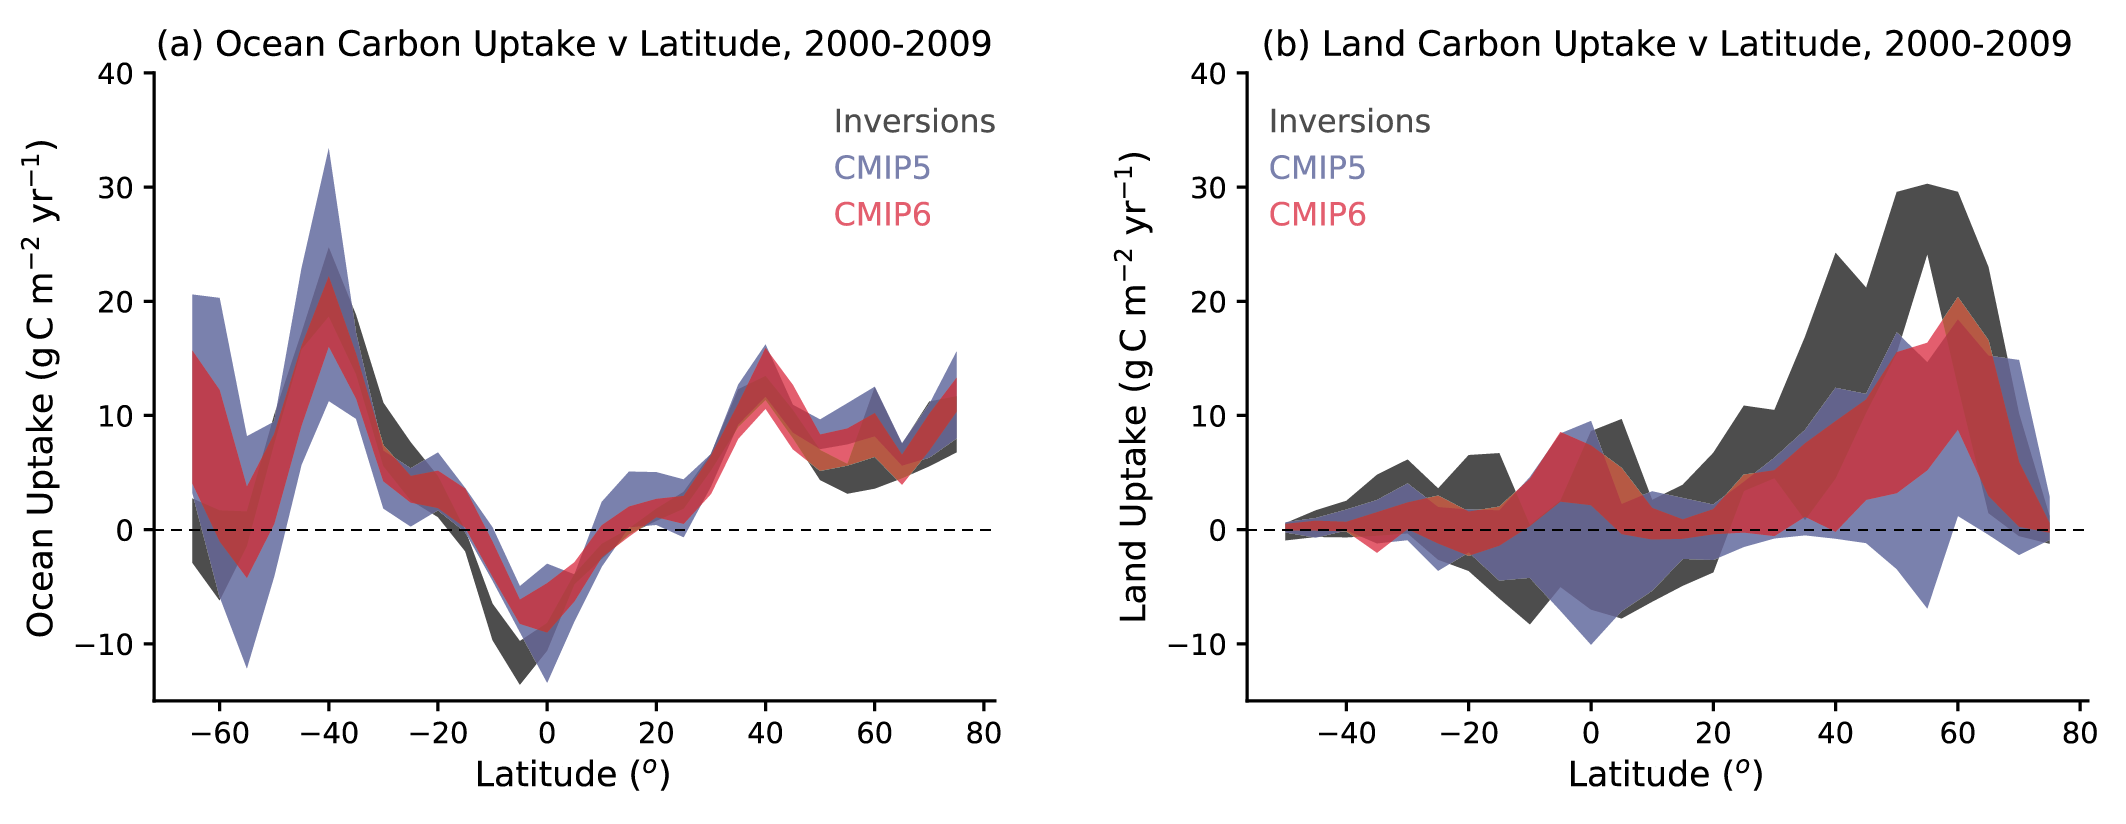
Figure caption
Figure 5.24 | Comparison of modelled zonal distribution of contemporary carbon sinks against atmospheric inversion estimates for 2000–2009: (a) ocean carbon uptake; (b) net land uptake. Latitude runs from 90°S (i.e., –90°N) to 90°N. Positive uptake represents a carbon sink to ocean/land while negative uptake represents a carbon source. The land uptake is taken as net biome productivity (NBP) and so includes net land-use change emissions. The bands show the mean ±1 standard deviation across the available inversions (black bands, 3 models), CMIP5 Earth system models (ESMs) (blue bands, 12 models for the ocean, 12 models for the land), and CMIP6 ESMs (red bands, 11 models for ocean, 10 models for land). Further details on data sources and processing are available in the chapter data table (Table 5.SM.6).