Back chapter figures
Figure 5.25
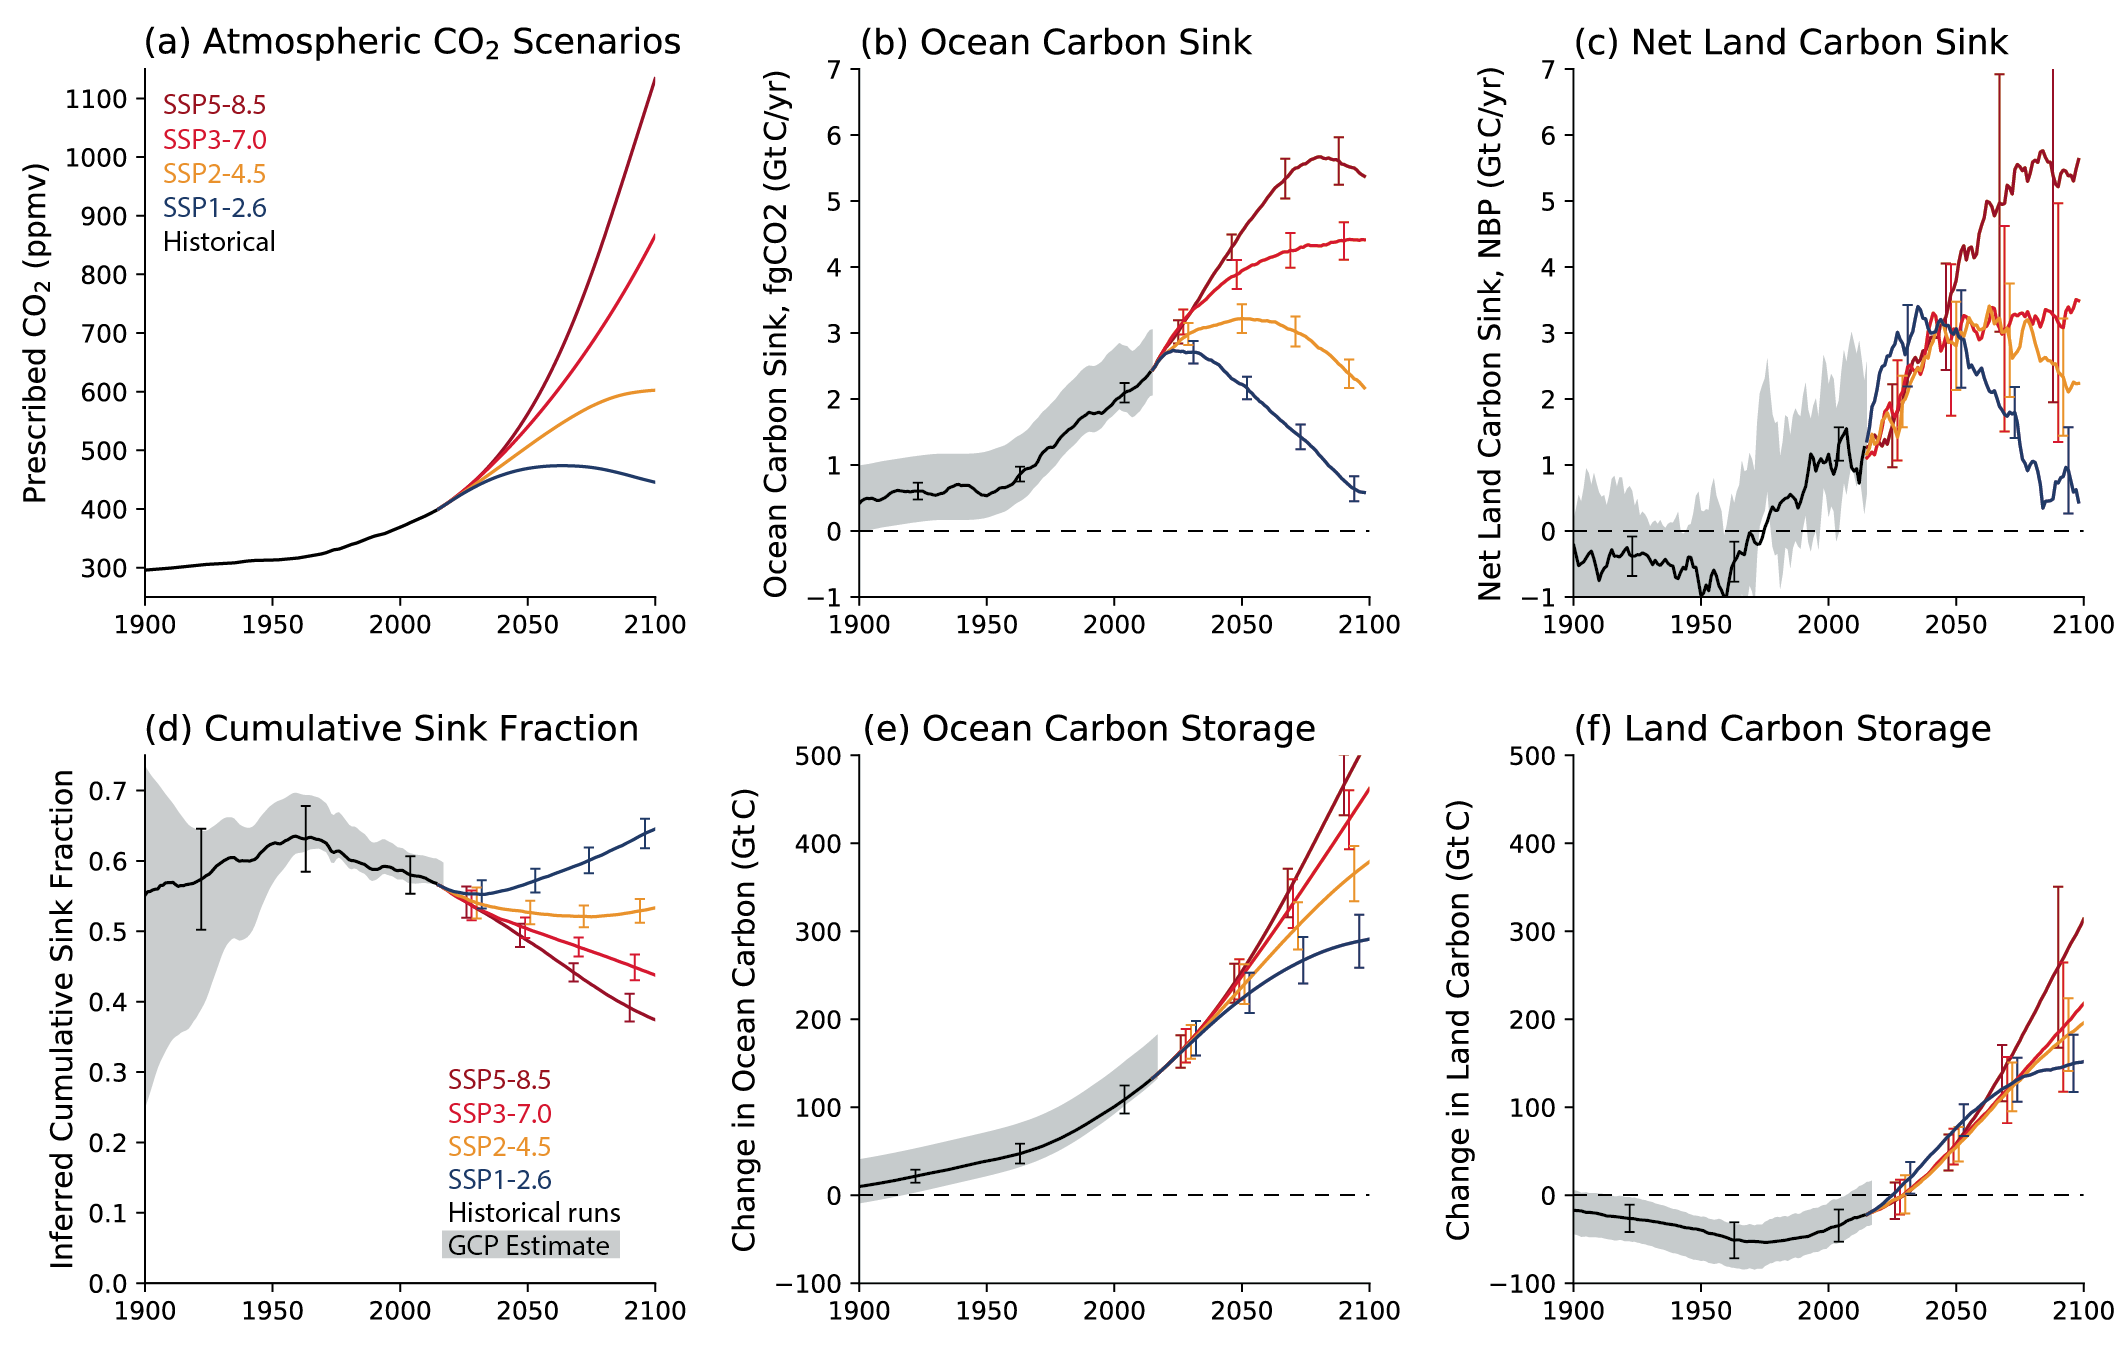
Figure caption
Figure 5.25 | Modelled evolution of the global land and ocean carbon sinks for 1900 to 2100 in concentration-driven CMIP6 Earth system model (ESM) scenario runs. (SSP1-2.6: blue; SSP2-4.5: orange; SSP3-7.0: red; SSP5-8.5: brown): (a) prescribed atmospheric CO2 concentrations; (b) five-year running mean ocean carbon sink (GtC yr–1); (c) five-year running mean net land carbon sink (GtC yr–1); (d) inferred cumulative sink fraction of emissions from 1850; (e) change in ocean carbon storage from 1850 (GtC); (f) change in land carbon storage from 1850 (GtC). Thick lines represent the ensemble mean of the listed ESM runs, and the error bars represents ± 1 standard deviation about that mean. The grey wedges represent estimates from the global carbon project (GCP), assuming uncertainties in the annual mean ocean and net land carbon sinks of 0.5 GtC yr–1 and 1 GtC yr–1 respectively, and uncertainties in the changes in carbon stores (ocean, land and cumulative total emissions) of 25 GtC. The net land carbon sink is taken as net biome productivity (NBP) and so includes any modelled net land-use change emissions. Further details on data sources and processing are available in the chapter data table (Table 5.SM.6).