Back chapter figures
Figure 5.26
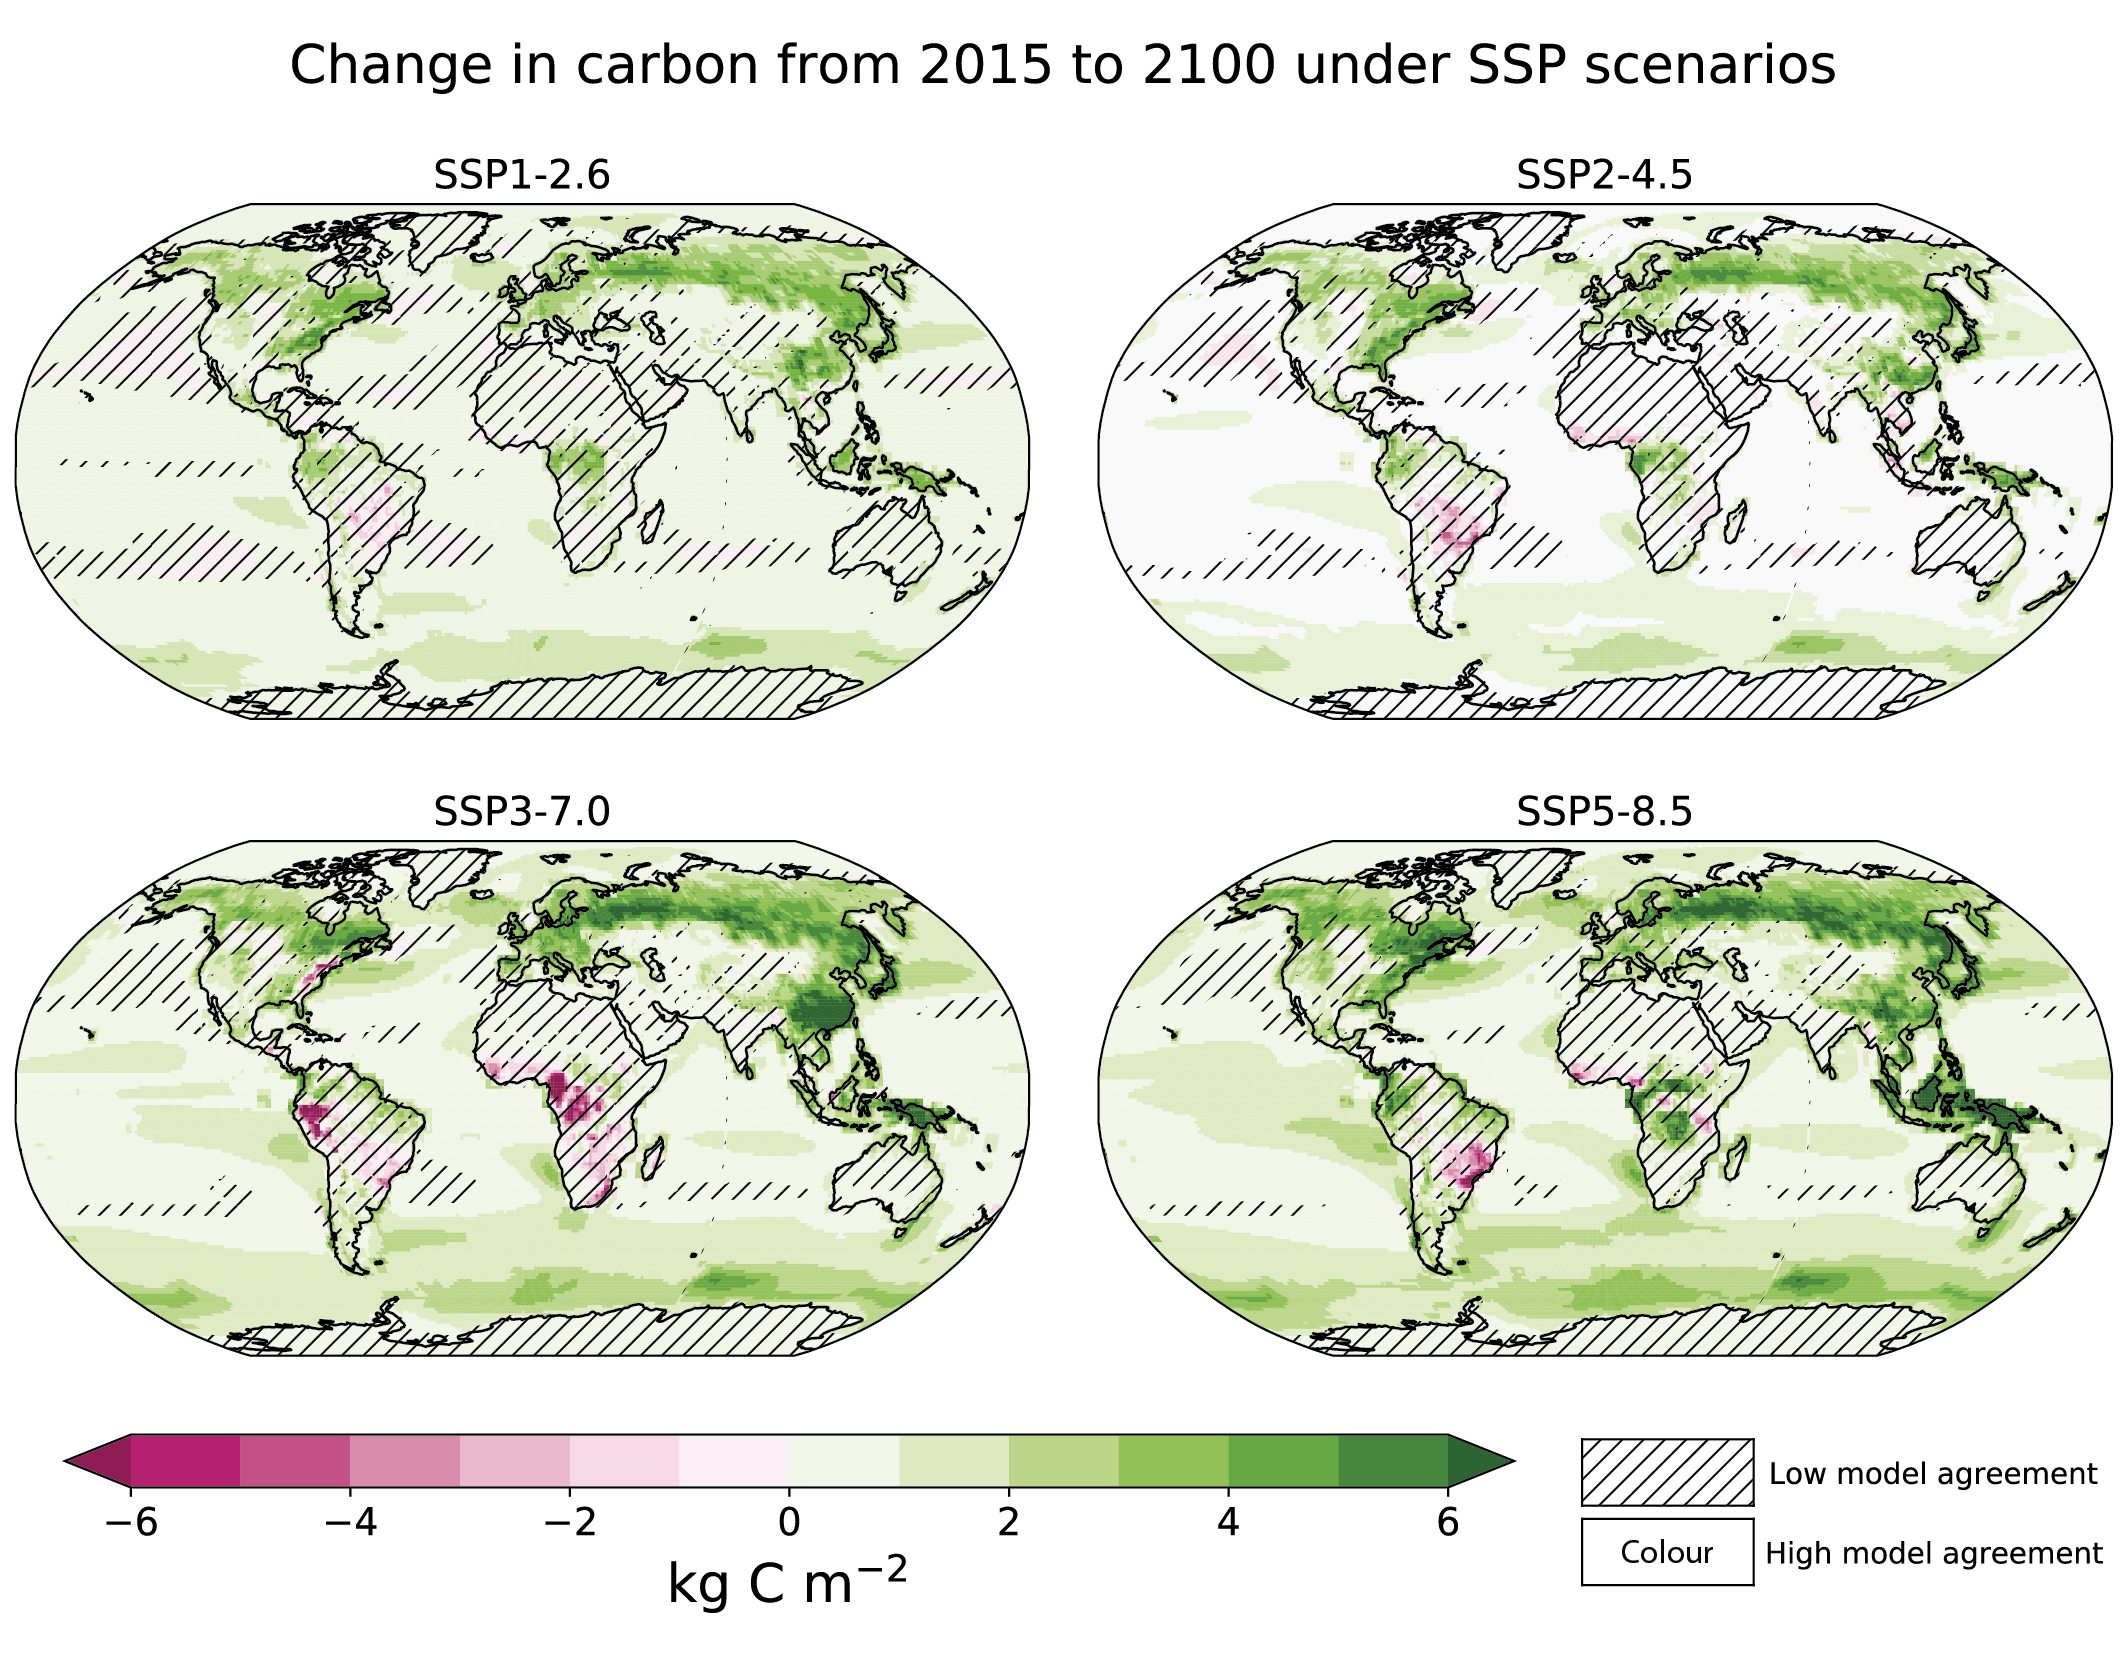
Figure caption
Figure 5.26 | Maps of net carbon changes under four Shared Socio-economic Pathway (SSP) scenarios, as evaluated from nine CMIP6 Earth system models. Uncertainty is represented using the simple approach (see Cross-Chapter Box Atlas.1 for more information). No overlay indicates regions with high model agreement, where ≥80% of models agree with the ensemble mean on the sign of change. Diagonal lines indicate regions with low model agreement, where <80% of models agree with the ensemble mean on the sign of change. On land, this is calculated as the time integral of net biome productivity (NBP), for the ocean it is the time-integral of air–sea carbon dioxide (CO2) gas flux anomalies relative to the pre-industrial. Further details on data sources and processing are available in the chapter data table (Table 5.SM.6).