Back chapter figures
Figure 5.27
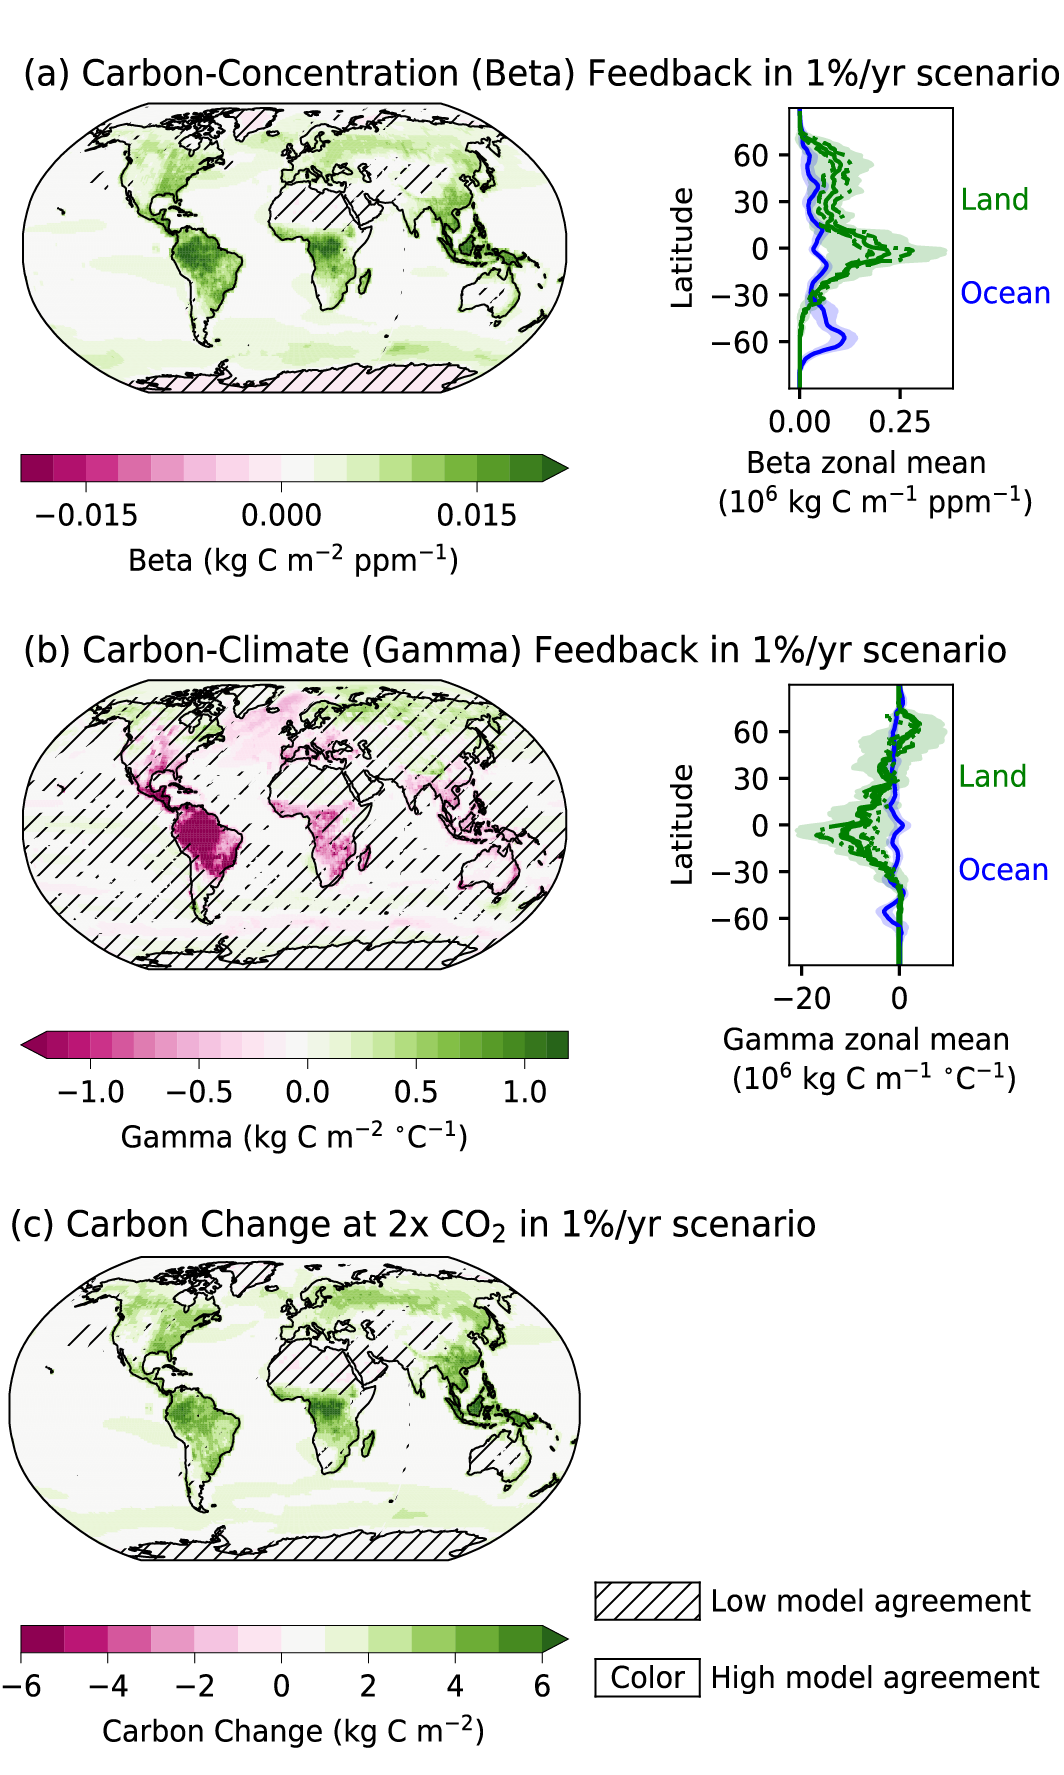
Figure caption
Figure 5.27 | Maps of carbon-concentration and carbon–climate feedback terms, as well as net carbon changes under the idealized 1% per year carbon dioxide (CO2) scenario, as evaluated from CMIP6 Earth system models (ESMs). Shown are the model means from nine CMIP6 ESMs. Uncertainty is represented using the simple approach (see Cross-Chapter Box Atlas.1 for more information): No overlay indicates regions with high model agreement, where ≥80% of models agree with the ensemble mean on the sign of change; diagonal lines indicate regions with low model agreement, where <80% of models agree with the ensemble mean on the sign of change. Also shown are zonal-mean latitude profiles of land (green) and ocean (blue) feedbacks. On the land, the zonal mean feedback for the mean of the ensemble of models that include nitrogen is shown as dashed lines, and for carbon-only models as dash-dotted lines, and the carbon–climate feedback from one permafrost-carbon enabled ESM is shown as a dotted line. Carbon changes are calculated as the difference between carbon stocks at different times on land and for the ocean as the time integral of atmosphere–ocean CO2 flux anomalies relative to the pre-industrial. The denominator for gamma here is the global mean surface air temperature. Further details on data sources and processing are available in the chapter data table (Table 5.SM.6).