Back chapter figures
Figure 5.29
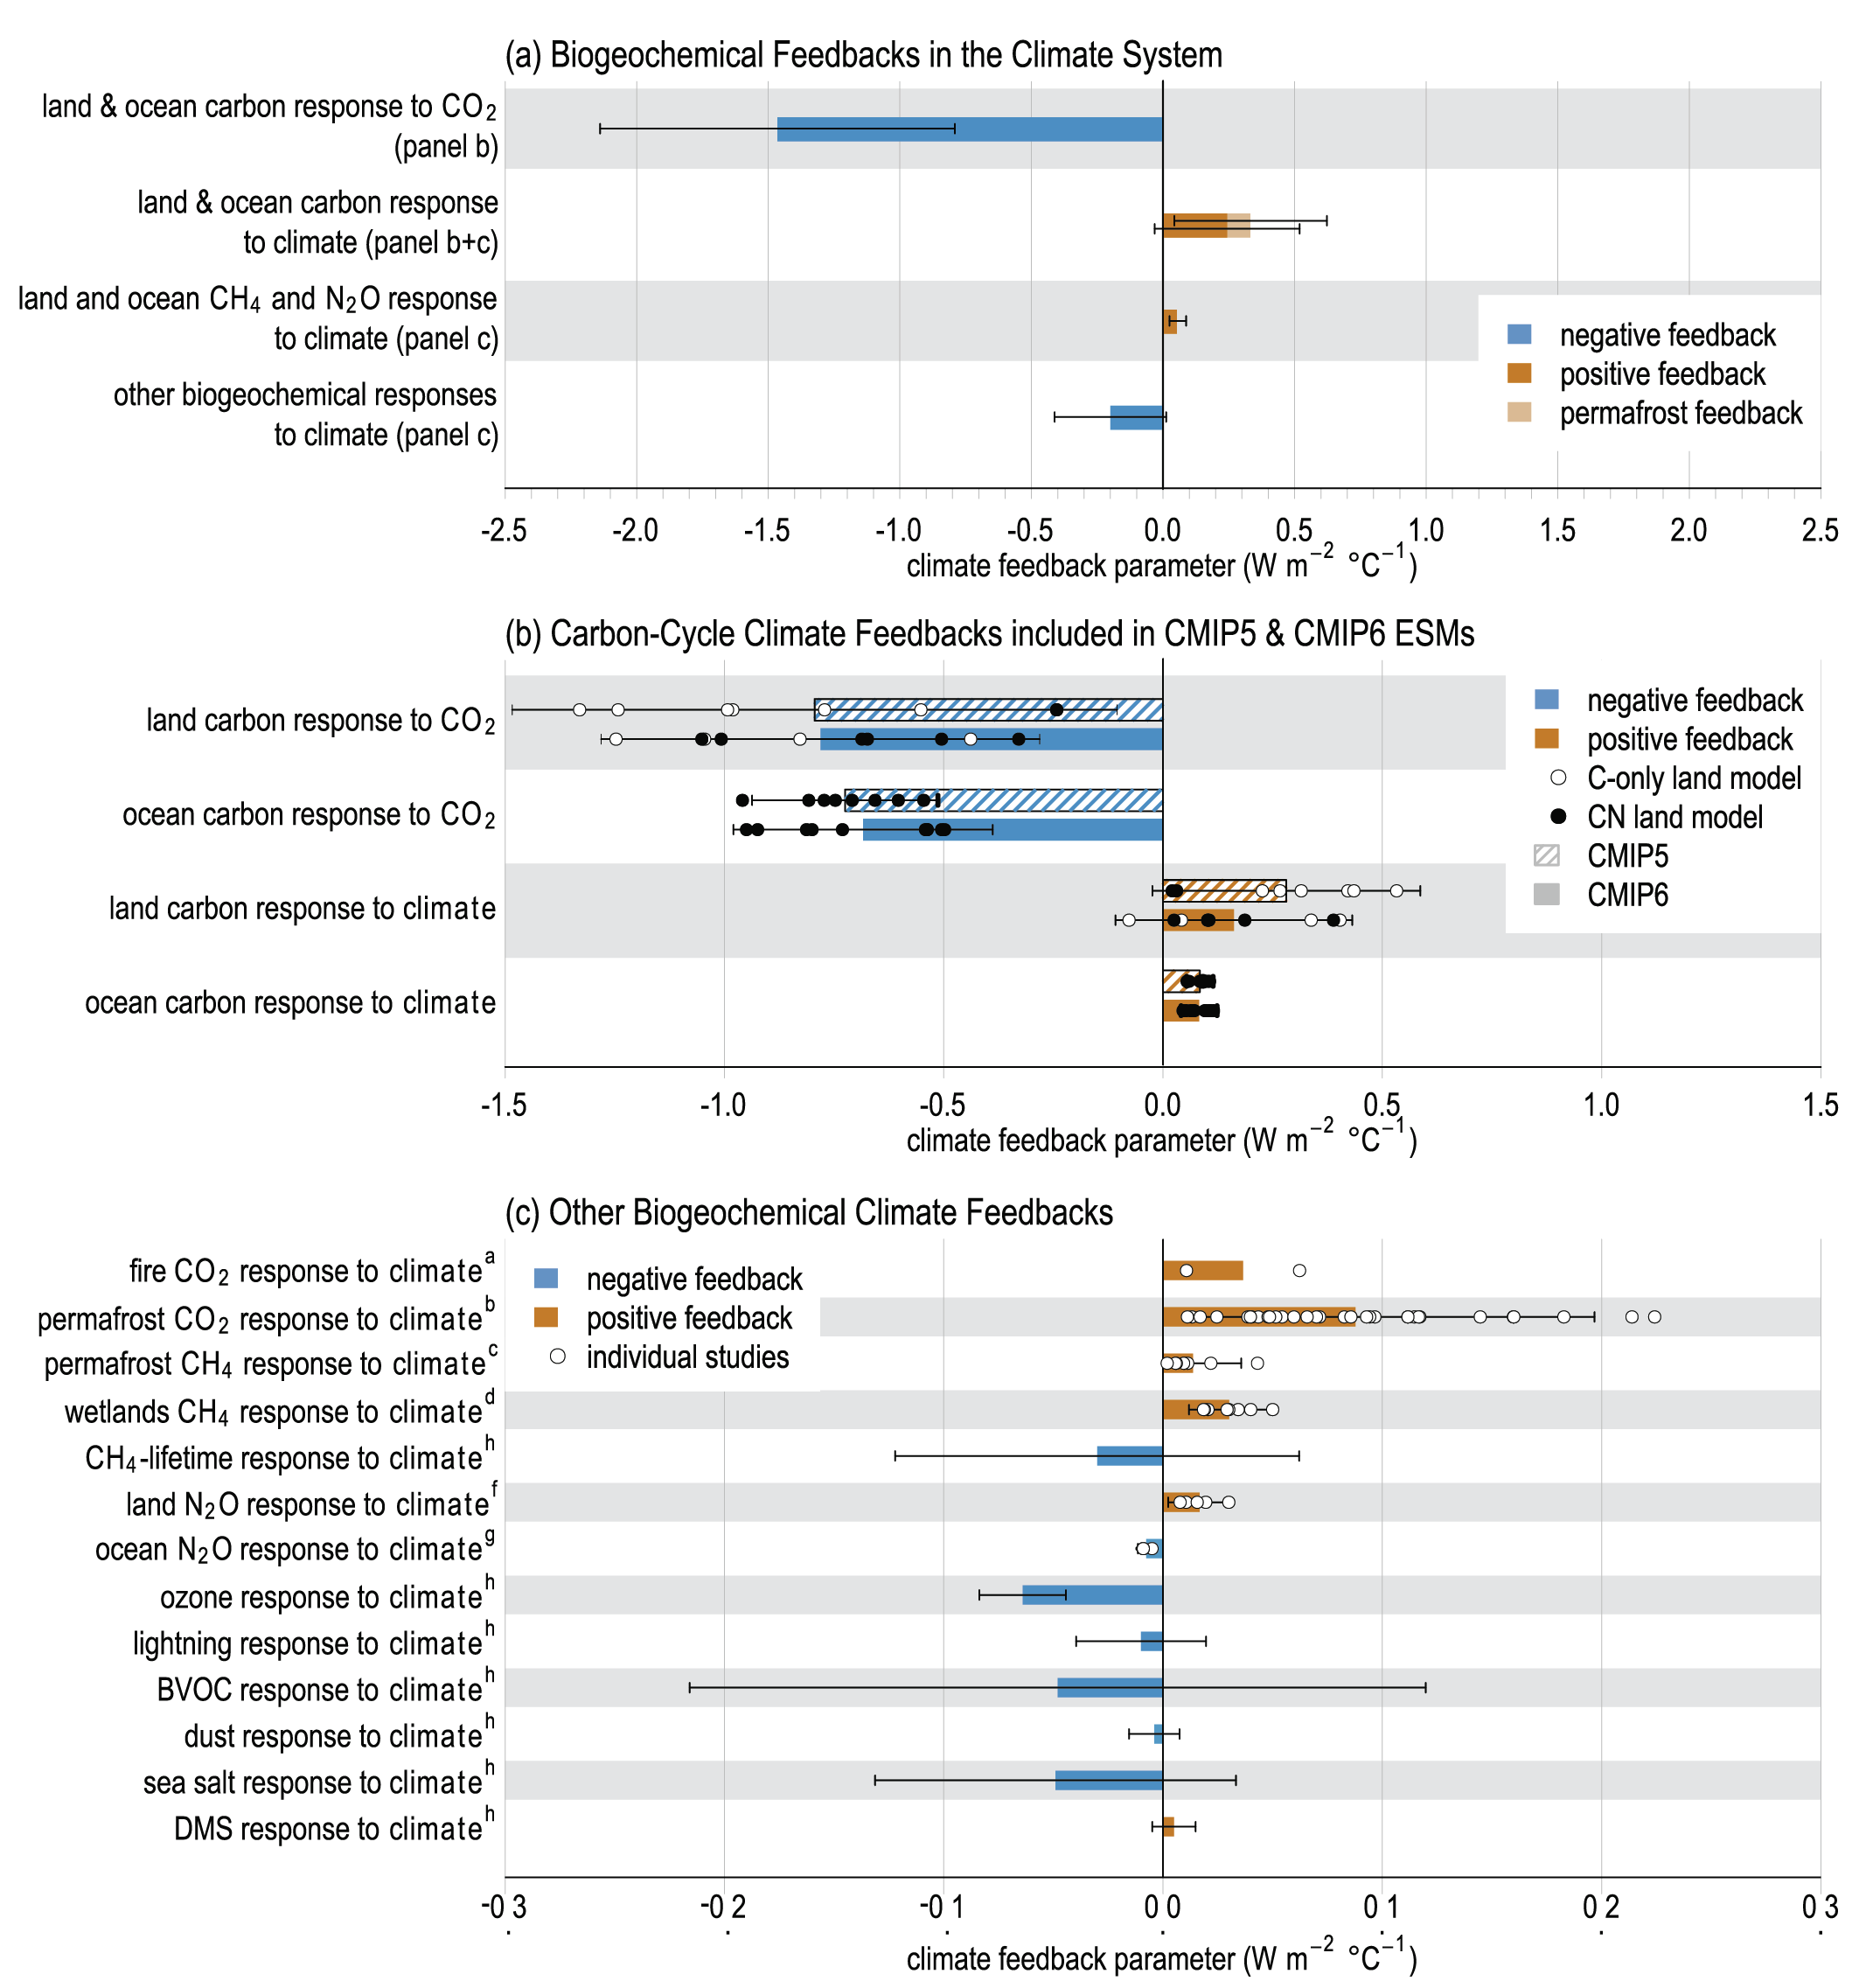
Figure caption
Figure 5.29 | Estimates of the biogeochemical climate feedback parameter ( α ). The parameter α (W m−2°C−1) for a feedback variable x is defined as is the change in top-of-atmosphere energy balance in response to a change inx induced by a change in surface temperature (T), as in Section 7.4.1.1. (a) Synthesis of biogeochemical feedbacks from panels (b) and (c). Orange (blue) bars correspond to positive (negative) feedbacks increasing (decreasing) radiative forcing at the top of the atmosphere. Bars denote the mean and the error bar represents the 5–95% range of the estimates; (b) carbon-cycle feedbacks as estimated by coupled carbon-cycle climate models in the CMIP5 (Arora et al., 2013) and CMIP6 (Arora et al., 2020) ensembles, where dots represent single model estimates, and filled (open) circles are those estimates which do (not) include the representation of a terrestrial nitrogen cycle; (c) Estimates of other biogeochemical feedback mechanisms based on various modelling studies. Dots represent single estimates, and coloured bars denote the mean of these estimates with no weighting being made regarding the likelihood of any single estimate, and error bars the 5–95% range derived from these estimates. Results in panel (c) have been compiled from (a)Section 5.4.3.2 (Eliseev et al., 2014a; Harrison et al., 2018); (b)Section 5.4.3.3 (Schneider von Deimling et al., 2012; Burke et al., 2013, 2017b; Koven et al., 2015a, c; MacDougall and Knutti, 2016b; Gasser et al., 2018; Kleinen and Brovkin, 2018), where the estimates from Burke et al., 2013 have been constrained as assessed in their study (c)Section 5.4.7 (Schneider von Deimling et al., 2012, 2015; Koven et al., 2015c; Turetsky et al., 2020); (d)Section 5.4.7 (Arneth et al., 2010; Denisov et al., 2013; Shindell et al., 2013; B.D. Stocker et al., 2013; Zhang et al., 2017); (f)Section 5.4.7 (Xu-Ri et al., 2012; B.D. Stocker et al., 2013; Zaehle, 2013; Tian et al., 2019); (g)Section 5.4.7 (Martinez-Rey et al., 2015; Landolfi et al., 2017; Battaglia and Joos, 2018b). (h) Section 6.3, Table 6.9 mean and the 5–95%range the assessed feedback parameter. Further details on data sources and processing are available in the chapter data table (Table 5.SM.6).
αx =
where δN dx δx dT
δN δx