Back chapter figures
Figure 5.3
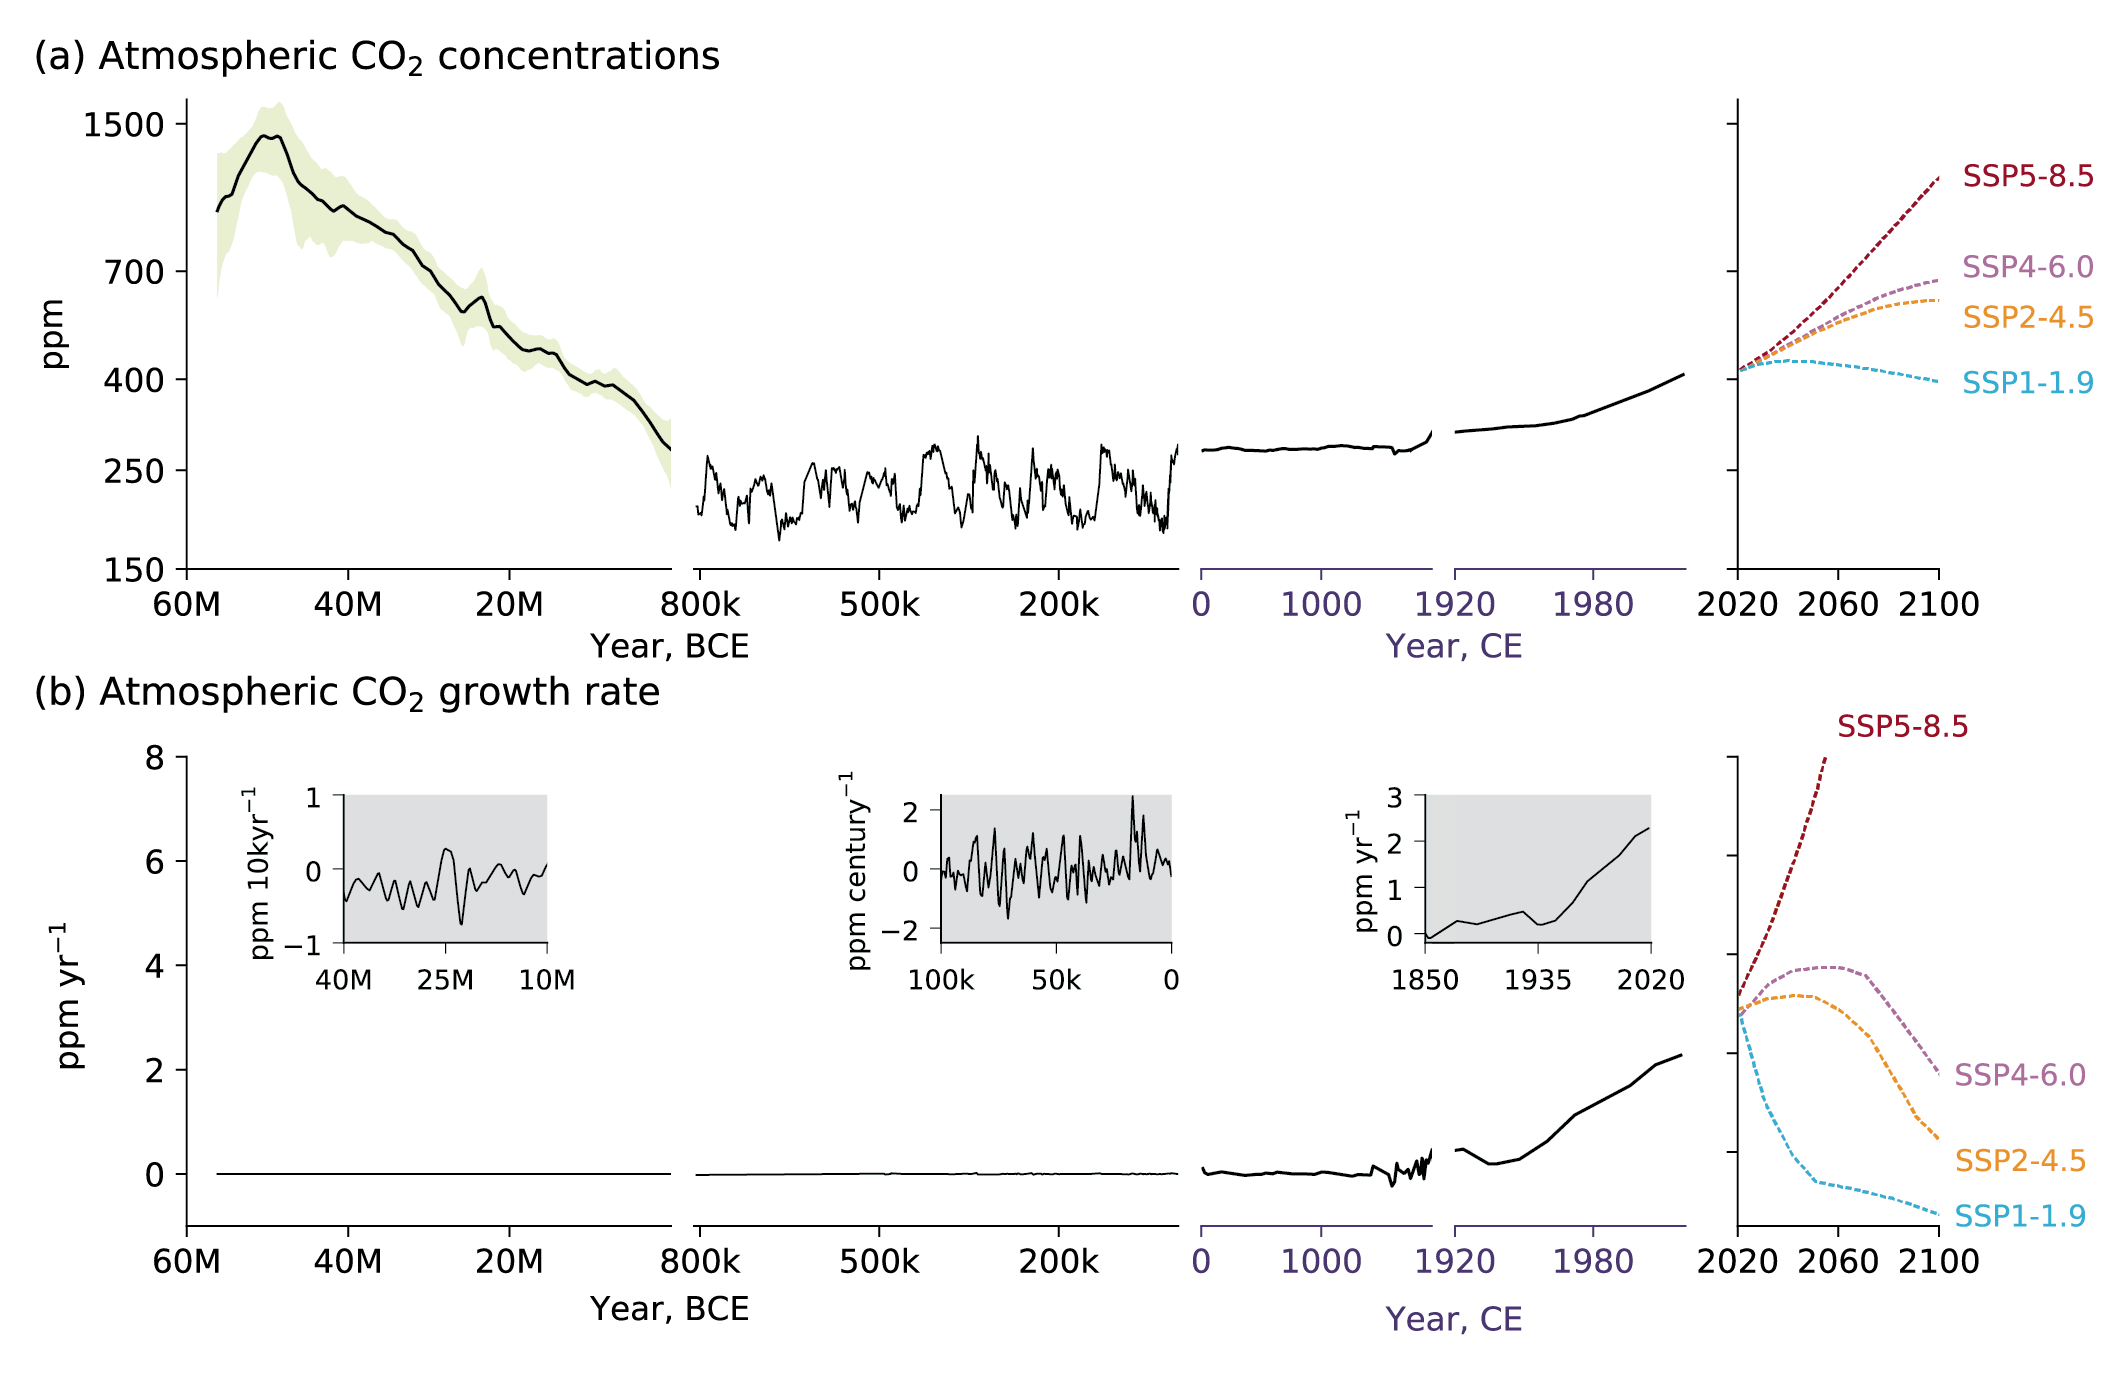
Figure caption
Figure 5.3 | Atmospheric CO2 concentrations and growth rates for the past 60 million years (Myr) and projections to 2100. (a) CO2 concentrations data for the period 60 Myr to the time prior to 800 kyr (left column) are shown as the LOESS Fit and 68% range (data from Chapter 2) (Foster et al., 2017). Concentrations from 1750 and projections through 2100 are taken from Shared Socio-economic Pathways of IPCC AR6 (Meinshausen et al., 2017). (b) Growth rates are shown as the time derivative of the concentration time series. Inserts in (b) show growth rates at the scale of the sampling resolution. Further details on data sources and processing are available in the chapter data table (Table 5.SM.6).