Back chapter figures
Figure 5.30
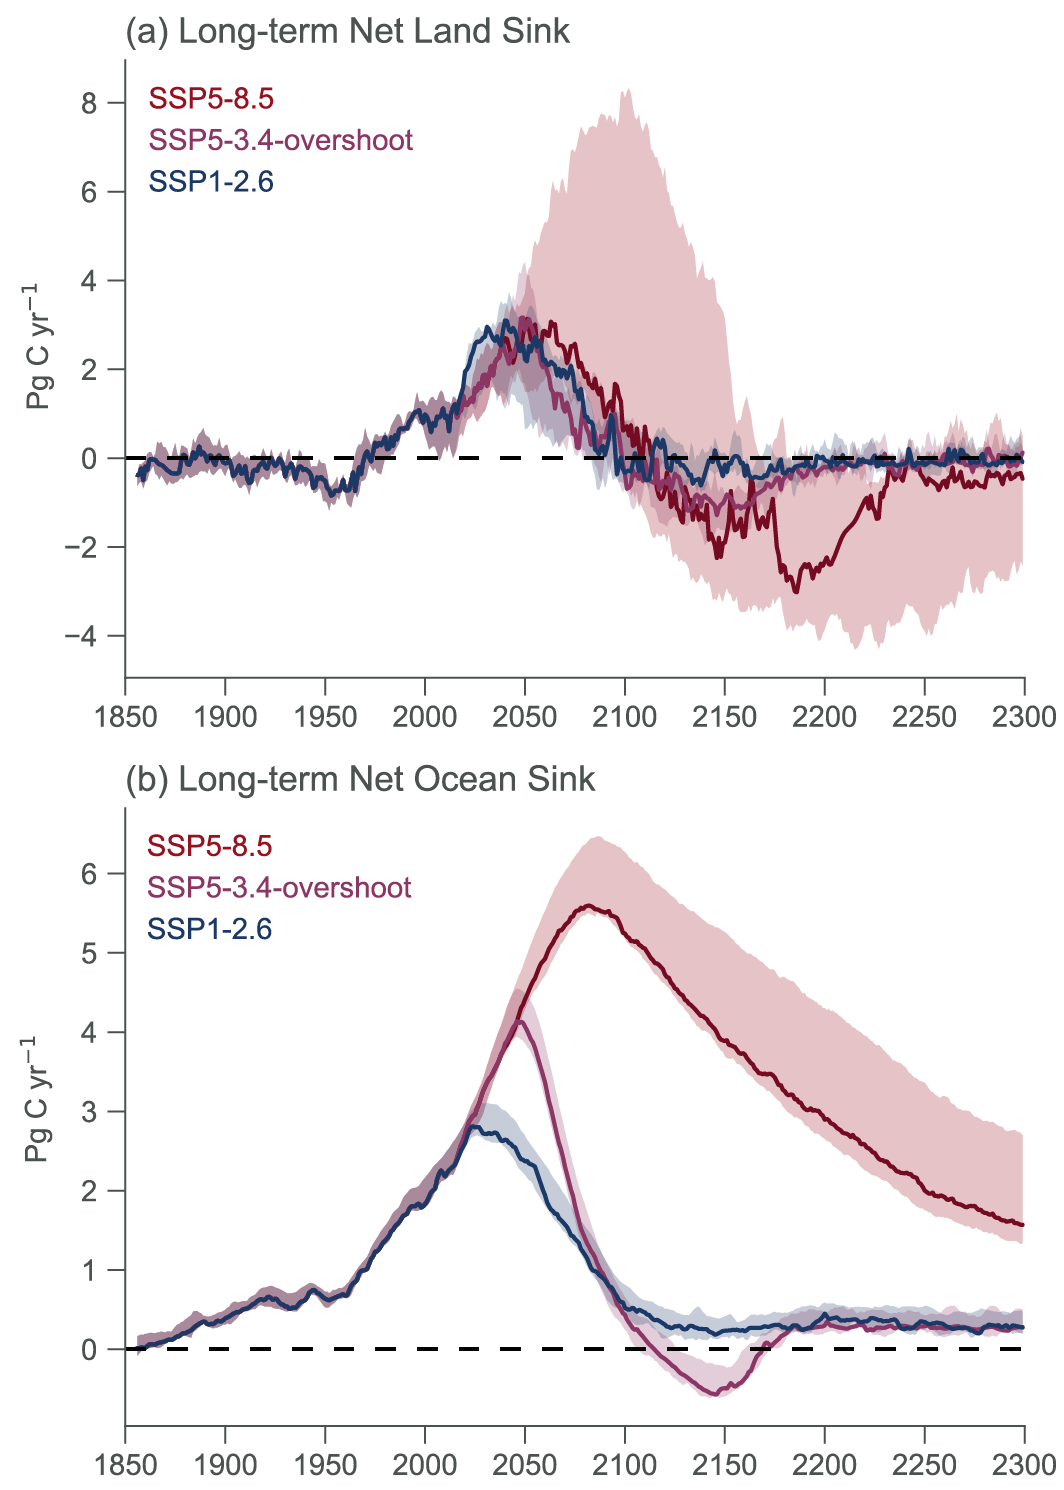
Figure caption
Figure 5.30 | Trajectories of carbon cycle dynamics for models beyond 2100. Shown are three scenarios: SSP5-8.5; SSP5-3.4-overshoot; and SSP1-2.6, from four ESMs (CanESM5, UKESM1, CESM2-WACCM, IPSL-CM6a-LR) and one EMIC (UVIC-ESCM, Mengis et al., 2020) for which extensions beyond 2100 are available. Solid lines represent the median flux value across the ensemble, and shading represents 15th–85th percentiles across the ensemble. Further details on data sources and processing are available in the chapter data table (Table 5.SM.6).