Back chapter figures
Figure 5.35
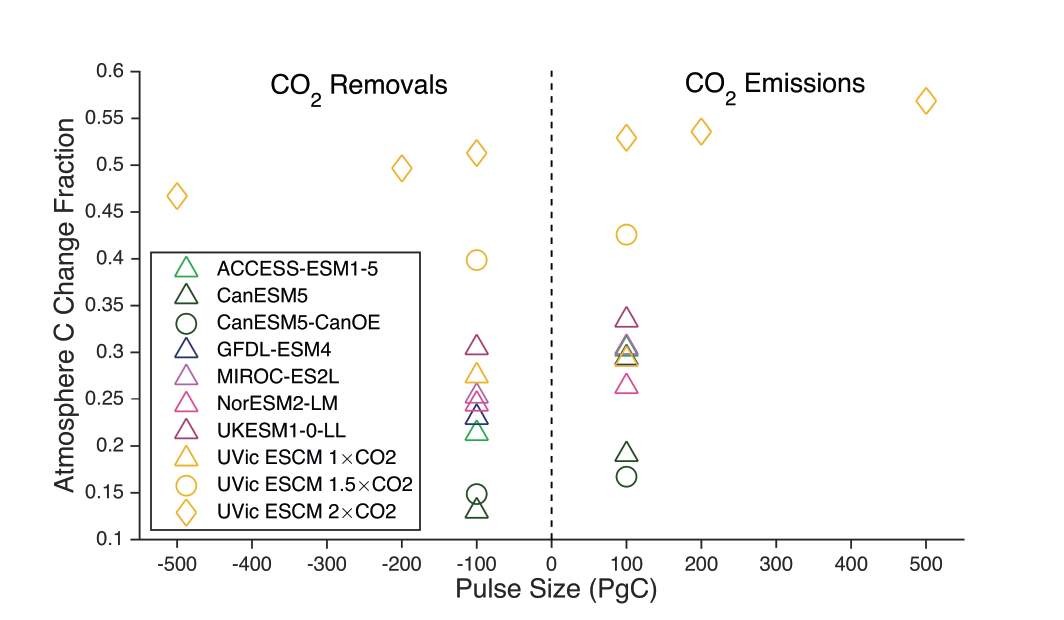
Figure caption
Figure 5.35 | Asymmetry in the atmospheric carbon dioxide (CO2) response to CO2 emissions and removals. Shown are the fractions of total CO2 emissions remaining in the atmosphere (right-hand side) and CO2 removals remaining out of the atmosphere (left-hand side) 80–100 after a pulse emission/removal. Triangles and green circles denote results for seven Earth system models (ESMs) and the UVic ESCM model of intermediate complexity forced with ±100 PgC pulses applied from a pre-industrial state (1 × CO2) (Carbon Dioxide Removal Model Intercomparison Project (CDRMIP) experiment CDR-pi-pulse; Keller et al., 2018b). Yellow circles and diamonds indicate UVic ESCM results for CO2 emissions/removals applied at 1.5 times (1.5 × CO2) and 2 times (2 × CO2) the pre-industrial CO2 concentration, respectively. Pulses applied from a 2 × CO2 state span the magnitude ±100 PgC to ±500 PgC. UVic ESCM data is from Zickfeld et al. (2021). Further details on data sources and processing are available in the chapter data table (Table 5.SM.6).