Back chapter figures
Figure 5.36
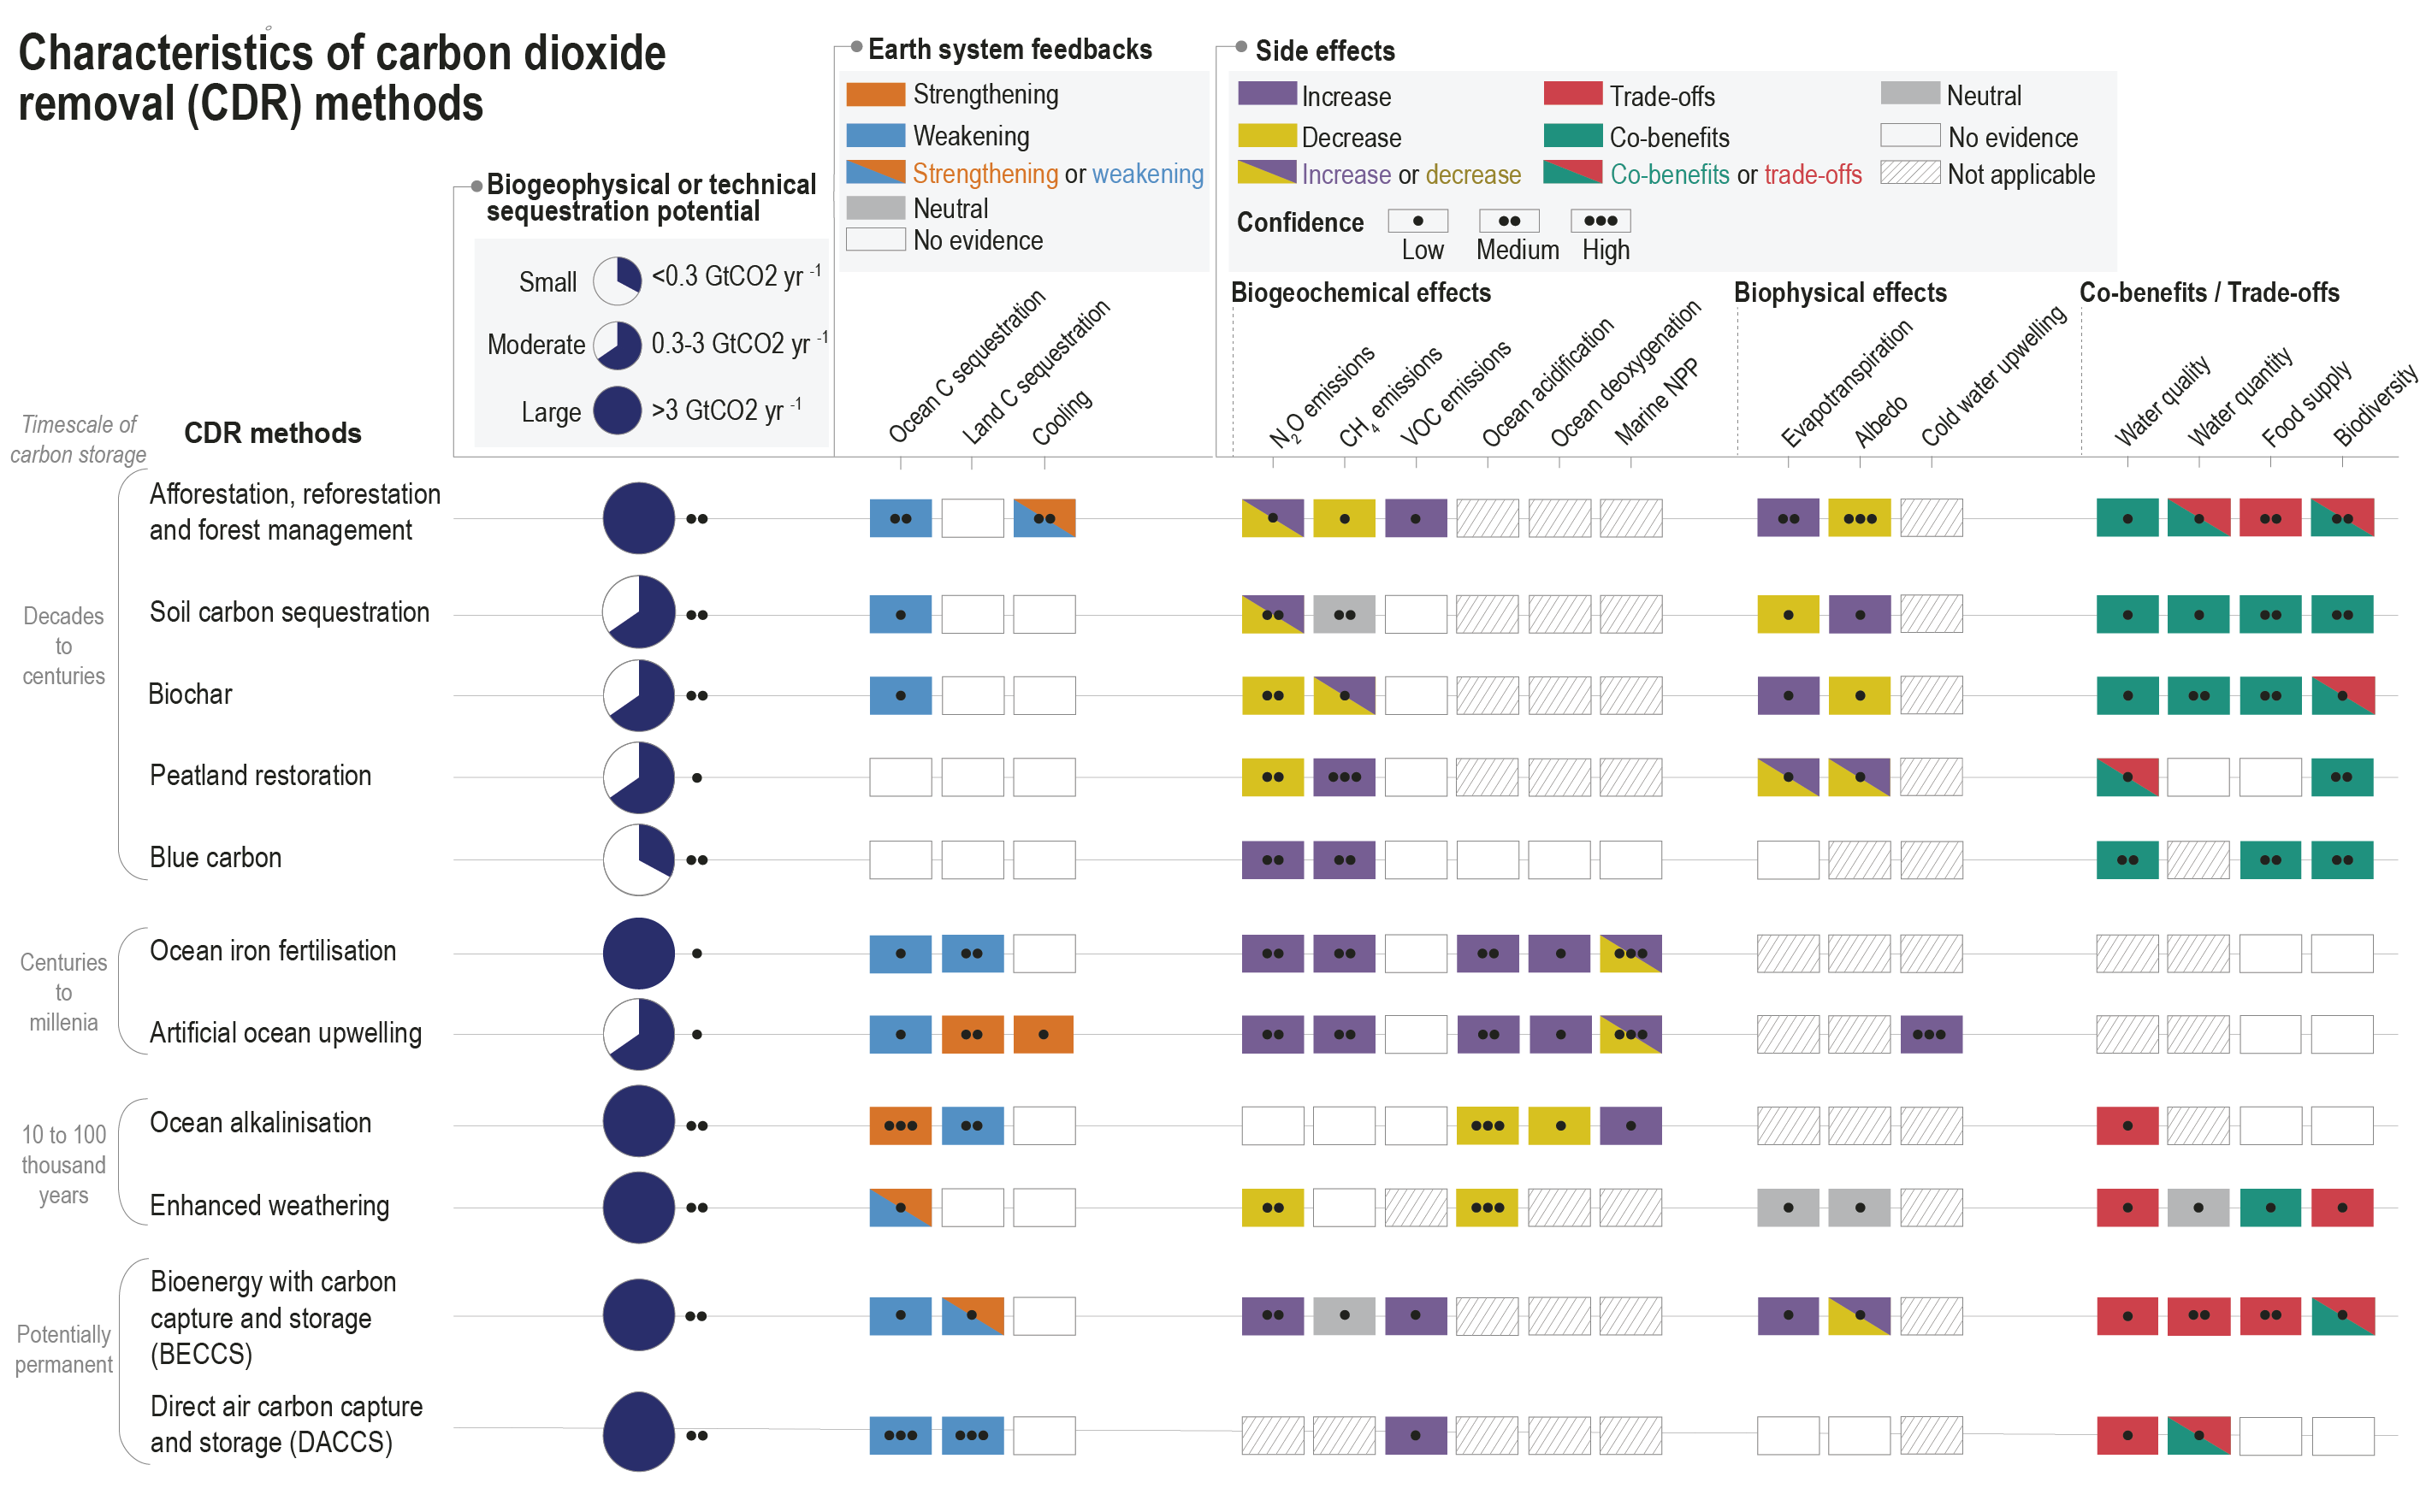
Figure caption
Figure 5.36 | Characteristics of carbon dioxide removal (CDR) methods, ordered according to the time scale of carbon storage. The first column shows biogeophysical (for open-ocean methods) or technical (for all other methods) sequestration potentials (i.e., the sequestration potentials constrained by biological, geophysical, geochemical limits and thermodynamics and, for technical potentials, availability of technologies and practices; technical potentials for some methods also consider social or environmental factors if these represent strong barriers for deployment; see Glossary, Annex VII), classified into low (<0.3 GtCO2 yr–1), moderate (0.3−3 GtCO2 yr–1) and large (>3 GtCO2 yr–1) (details underlying this classification are provided in Supplementary Materials Table 5.SM.5). The other columns show Earth system feedbacks that deployment of a given CDR method would have on carbon sequestration and climate, along with biogeochemical, biophysical, and other side effects of a given method. Earth system feedbacks do not include the direct effect of CO2 sequestration on atmospheric CO2, only secondary effects. For Earth system feedbacks, the colours indicate whether the feedbacks strengthen or weaken carbon sequestration and the climate cooling effect of a given CDR method. For biogeochemical and biophysical side effects the colours indicate whether the deployment of a CDR method increases or decreases the magnitude of the effect, whereas for co-benefits and trade-offs the colour indicates whether deployment of a CDR method results in beneficial (co-benefits) or adverse side effects (trade-offs) for water quality and quantity, food production and biodiversity. The details and references underlying the Earth system feedback and side effect assessment are provided in Supplementary Materials Table 5.SM.4. Further details on data sources and processing are available in the chapter data table (Table 5.SM.6).