Back chapter figures
Figure 5.4
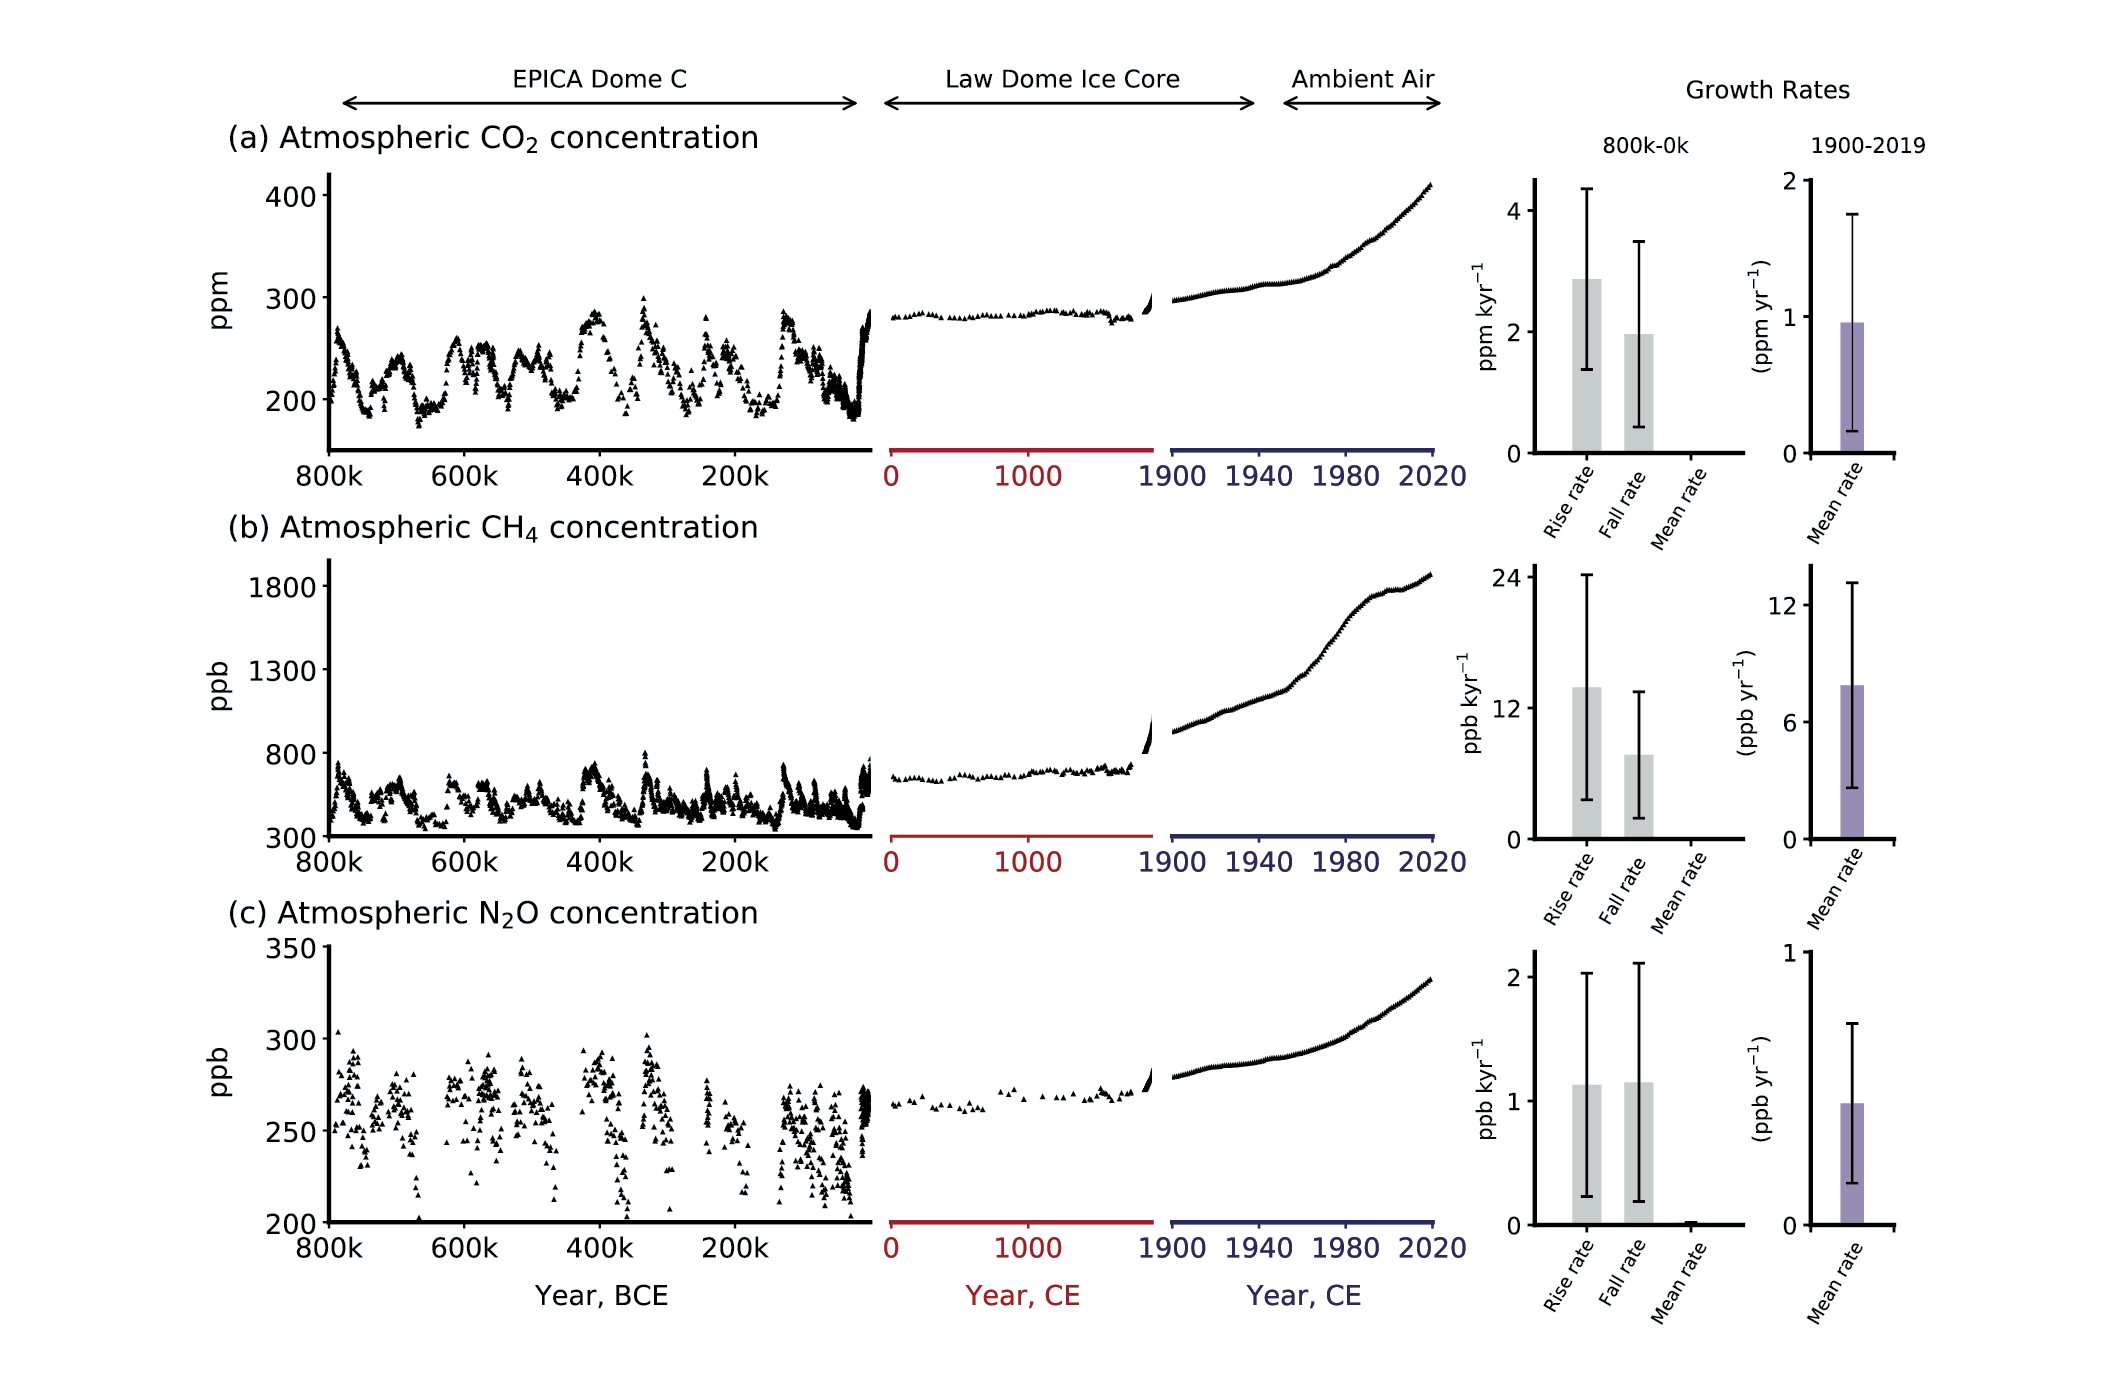
Figure caption
Figure 5.4 | Atmospheric concentrations of CO2, CH4and N2O in air bubbles and clathrate crystals in ice cores (800,000 BCE to 1990 CE). Note the variable x-axis range and tick mark intervals for the three columns. Ice core data is over-plotted by atmospheric observations from 1958 to present for CO2, from 1984 for CH4 and from 1994 for N2O. The time-integrated, millennial-scale linear growth rates for different time periods (800,000–0 BCE, 0–1900 CE and 1900–2017 CE) are given in each panel. For the BCE period, mean rise and fall rates are calculated for the individual slopes between the peaks (interglacials) and troughs (glacial periods), which are given in the panels in left column. The data for BCE period are used from the Vostok, EPICA, Dome C and WAIS ice cores (Petit et al., 1999; Monnin, 2001; Pépin et al., 2001; Raynaud et al., 2005; Siegenthaler et al., 2005; Loulergue et al., 2008; Lüthi et al., 2008; Schilt et al., 2010a). The data after 0–yr CE are taken mainly from Law Dome ice core analysis (MacFarling Meure et al., 2006). The surface observations for all species are taken from NOAA cooperative research network (Dlugokencky and Tans, 2019), where ALT, MLO and SPO stand for Alert (Canada), Mauna Loa Observatory, and South Pole Observatory, respectively. BCE = before current era, CE = current era. Further details on data sources and processing are available in the chapter data table (Table 5.SM.6).