Back chapter figures
Figure 5.7
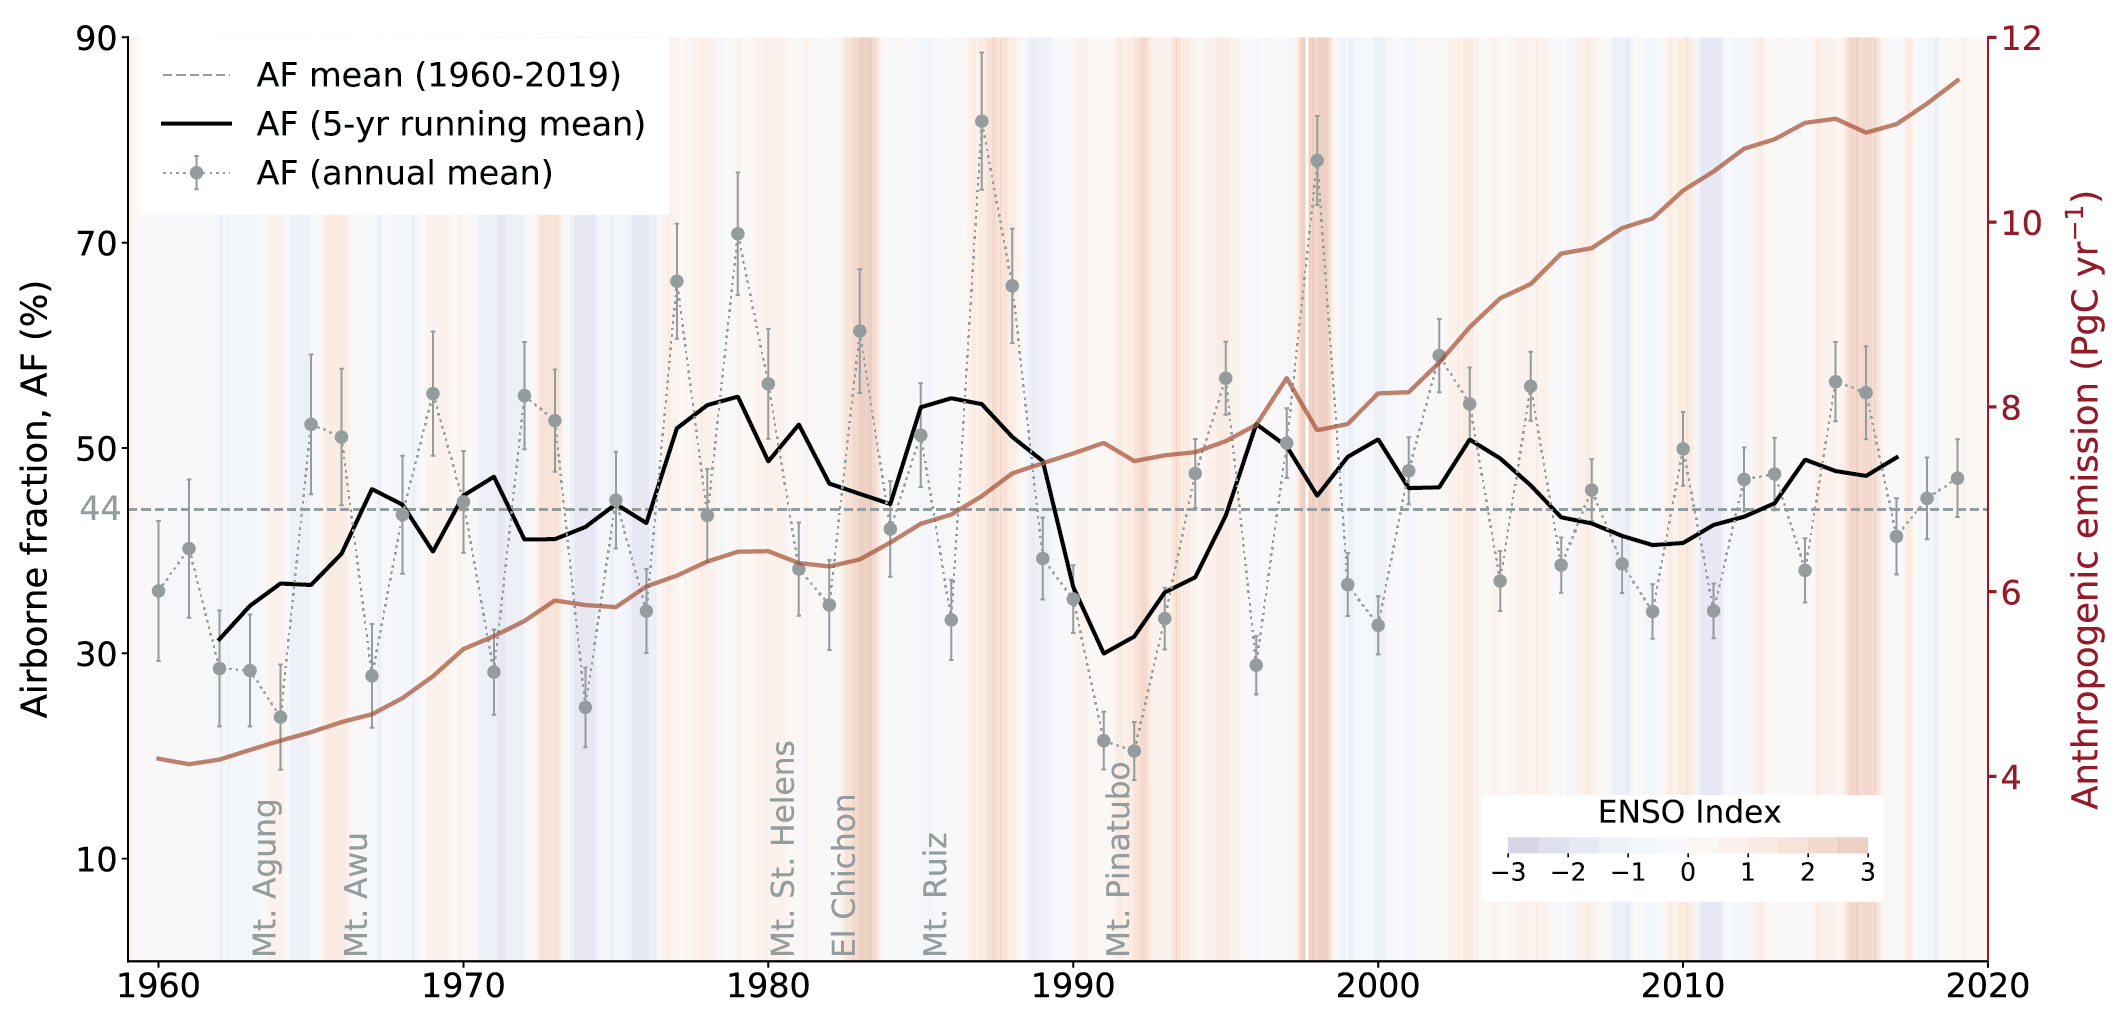
Figure caption
Figure 5.7 | Airborne fraction and anthropogenic (fossil fuel and land-use change) CO2 emissions. Data as in Section 5.2.1.1. The multivariate El Niño–Southern Oscillation (ENSO) index (shaded) and the major volcanic eruptions are marked along the x-axis. Further details on data sources and processing are available in the chapter data table (Table 5.SM.6).