Cross-Chapter Box 6.1, Figure 1
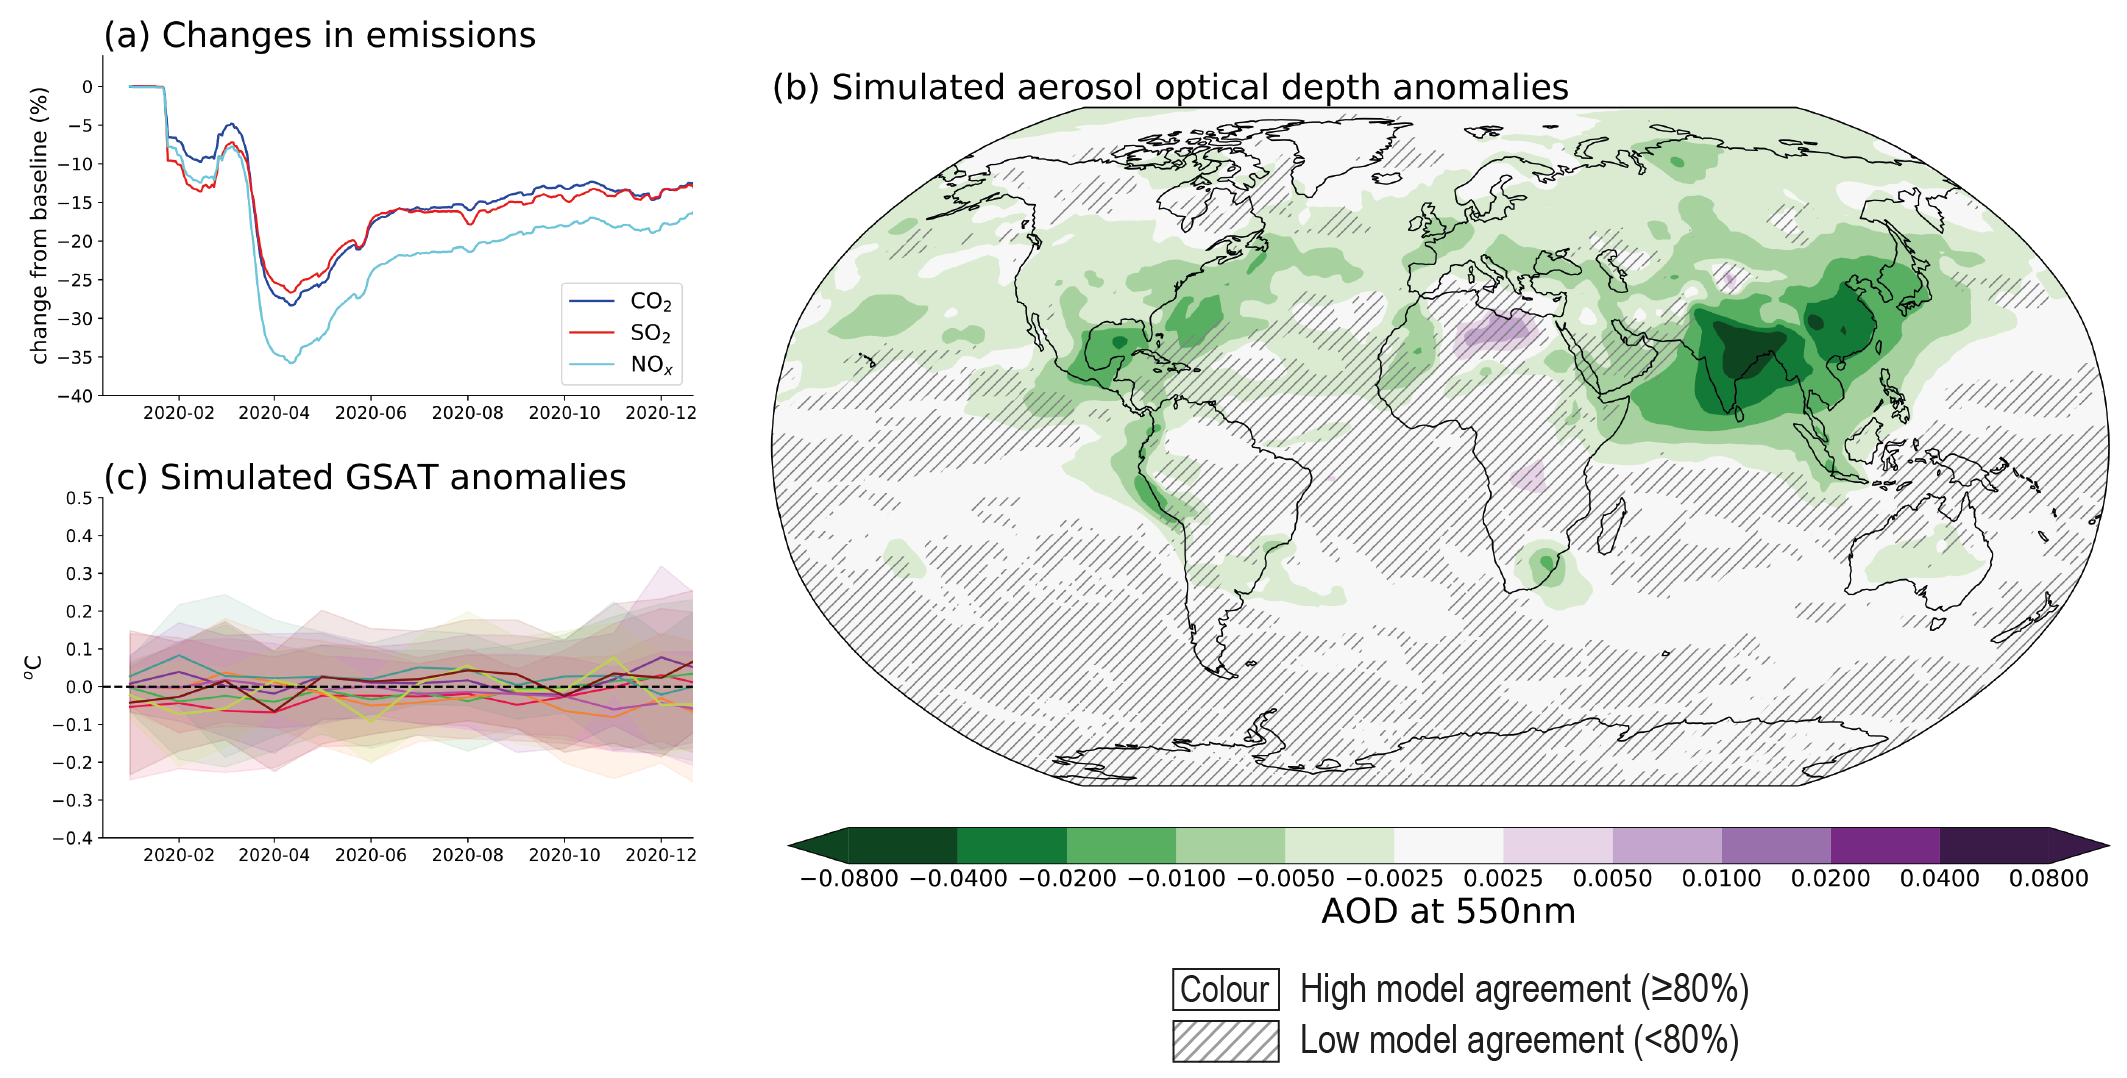
Figure caption
Cross-Chapter Box 6.1, Figure 1 | Emissions reductions and their effect on aerosols and climate in response to COVID-19. Estimated reductions in emissions of CO2, SO2 and NOx are shown in panel (a) based on reconstructions using activity data (updated from Forster et al., 2020). Eight Earth system models (ESMs) performed multiple ensemble simulations of the response to COVID-19 emissions reductions forced with these assumed emissions reductions up until August 2020 followed by a constant continuation near the August value to the end of 2020. Emissions reductions were applied relative to the SSP2-4.5 scenario. Panel (b) shows ESM-simulated AOD at 550nm (only seven models reported this variable). Panel (c) shows ESM-simulated GSAT anomalies during 2020; curves denote the ensemble mean result for each model with shading used for ±1 standard deviation for each model. ESM data from these simulations (‘ssp245-covid’) is archived on the Earth System Grid CMIP6 database. Uncertainty is represented using the simple approach: no overlay indicates regions with high model agreement, where ≥80% of models agree on sign of change; diagonal lines indicate regions with low model agreement, where <80% of models agree on sign of change. For more information on the simple approach, please refer to the Cross-Chapter Box Atlas.1.