Back chapter figures
Figure 6.10
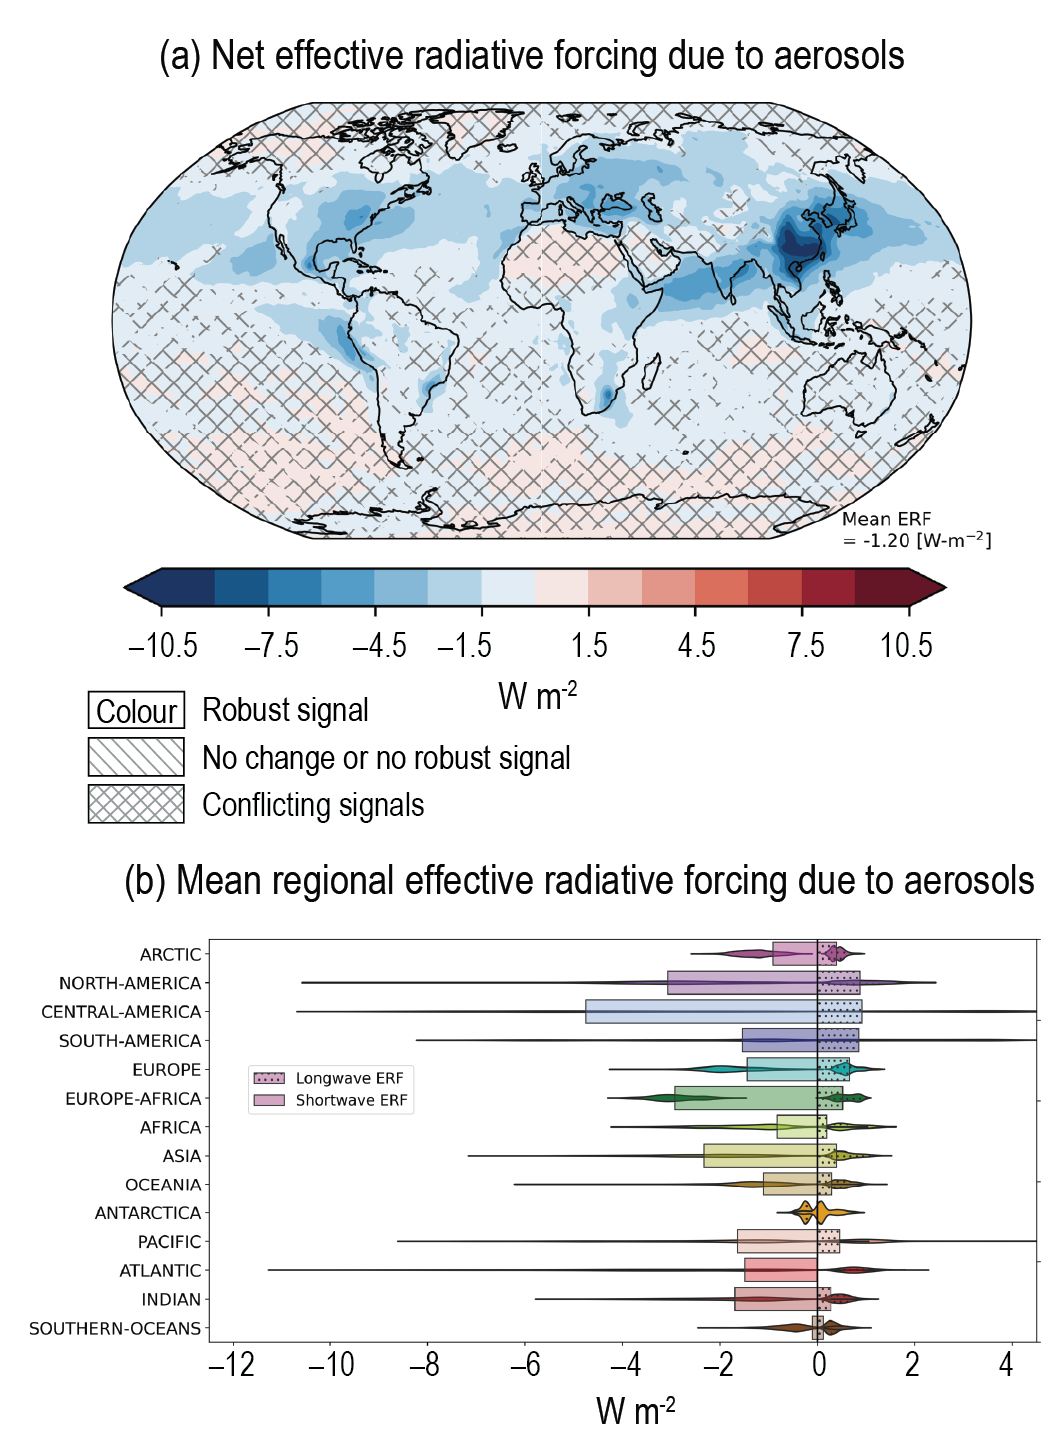
Figure caption
Figure 6.10 | Multi-model mean effective radiative forcings (ERFs) over the recent-past (1995-2014) induced by aerosol changes since 1850. Panel (a) shows the spatial distribution of the net ERF with area-weighted global mean ERF shown at the lower right corner. Uncertainty is represented using the advanced approach: no overlay indicates regions with robust signal, where ≥66% of models show change greater than variability threshold and ≥80% of all models agree on sign of change; diagonal lines indicate regions with no change or no robust signal, where <66% of models show a change greater than the variability threshold; crossed lines indicate regions with conflicting signal, where ≥66% of models show change greater than variability threshold and <80% of all models agree on sign of change. For more information on the advanced approach, please refer to the Cross-Chapter Box Atlas.1. Panel (b) shows the mean shortwave and longwave ERF for each of the 14 regions defined in the Atlas. Violins in panel (b) show the distribution of values over regions where ERFs are significant. ERFs are derived from the difference between top of the atmosphere (TOA) radiative fluxes for Aerosol Chemistry Model Intercomparison Project (AerChemMIP) experiments histSST and histSST-piAer (Collins et al., 2017) averaged over 1995–2014 (Box 1.4, Chapter 1). The results come from seven Earth system models: MIROC6, MPI-I-ESM-1-2-HAM, MRI-ESM2-0, GFDL-ESM4, GISS-E2-1-G, NorESM2-LM and UKESM-0-LL. These data can be seen in the Interactive Atlas. Further details on data sources and processing are available in the chapter data table (Table 6.SM.3).