Back chapter figures
Figure 6.11
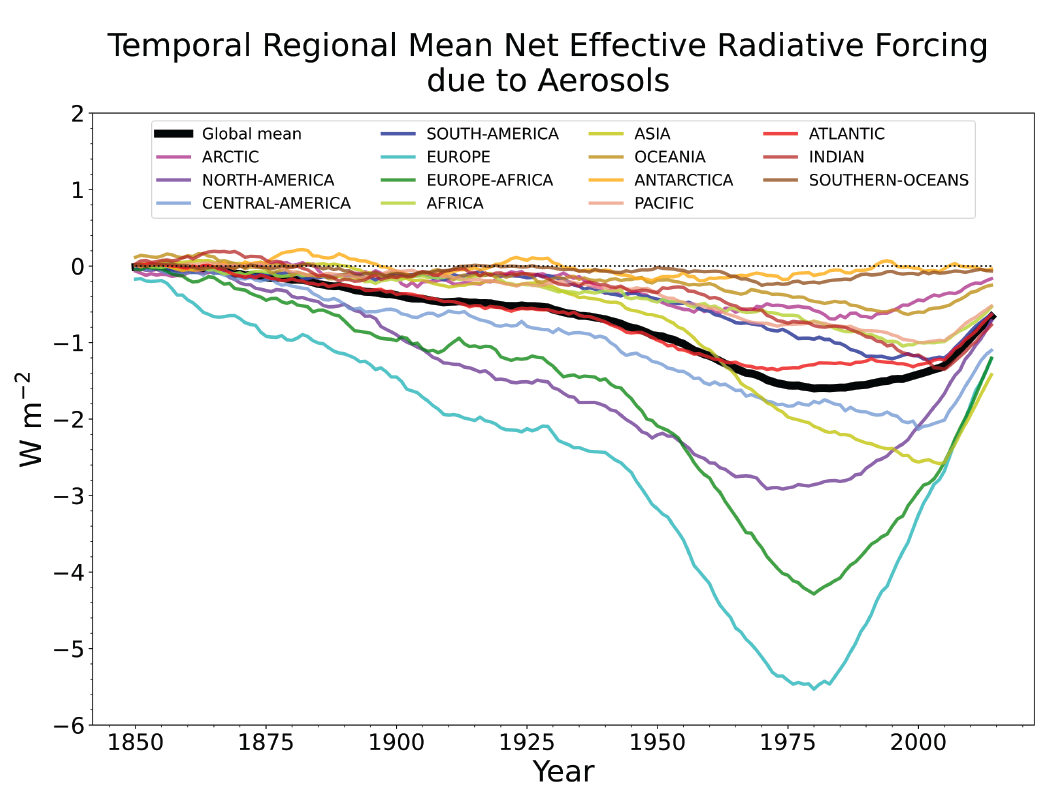
Figure caption
Figure 6.11 | Time evolution of 20-year multi-model mean averages of the annual area-weighted mean regional net effective radiative forcings (ERFs) due to aerosolsfor each of the 14 major regions in the Atlas, and global mean, using the models and model experiments as in Figure 6. 10. Further details on data sources and processing are available in the chapter data table (Table 6.SM.3).