Back chapter figures
Figure 6.12
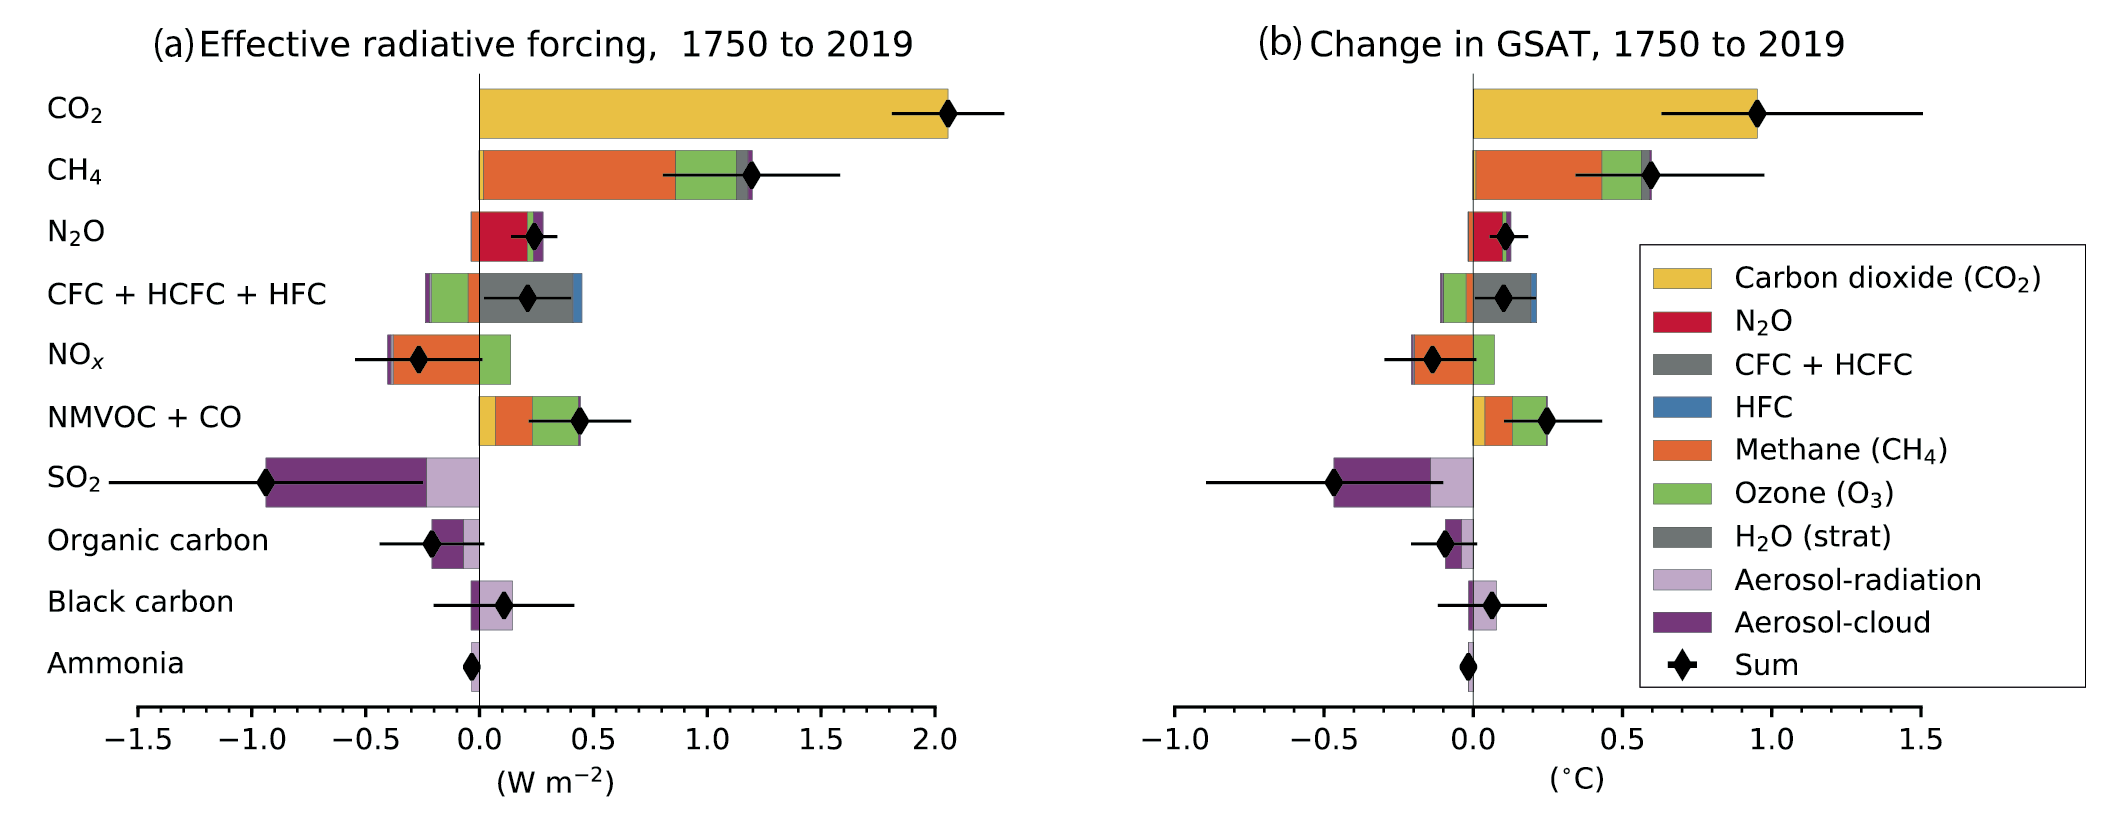
Figure caption
Figure 6.12 | Contribution to effective radiative forcing (ERF) (a) and global mean surface air temperature (GSAT) change (b) from component emissions between 1750 to 2019 based on CMIP6 models (Thornhill et al. , 2021b). ERFs for the direct effect of well-mixed greenhouse gases (WMGHGs) are from the analytical formulae in section 7.3.2, H2O (strat) is from Table 7.8. ERFs for other components are multi-model means from Thornhill et al. (2021b) and are based on ESM simulations in which emissions of one species at a time are increased from 1850 to 2014 levels. The derived emissions-based ERFs are rescaled to match the concentration-based ERFs in Figure 7.6. Error bars are 5–95% and for the ERF account for uncertainty in radiative efficiencies and multi-model error in the means. ERFs due to aerosol–radiation (ERFari) and cloud effects are calculated from separate radiation calls for clear-sky and aerosol-free conditions (Ghan, 2013; Thornhill et al., 2021b). ‘Cloud’ includes cloud adjustments (semi-direct effect) and ERF from indirect aerosol-cloud to –0.22 W m–2 for ERFari and –0.84 W m–2 interactions (ERFaci). The aerosol components (SO2, organic carbon and black carbon) are scaled to sum to –0.22 W m–2 for ERFari and –0.84 W m–2 for ‘cloud’ Section 7.3.3). For GSAT estimates, time series (1750–2019) for the ERFs have been estimated by scaling with concentrations for WMGHGs and with historical emissions for SLCFs. The time variation of ERFaci for aerosols is from Chapter 7. The global mean temperature response is calculated from the ERF time series using an impulse response function (Cross-Chapter Box 7.1) with a climate feedback parameter of –1.31 W m–2°C–1. Contributions to ERF and GSAT change from contrails and light-absorbing particles on snow and ice are not represented, but their estimates can be seen on Figure 7.6 and 7.7, respectively. Further details on data sources and processing are available in the chapter data table (Table 6.SM.3).