Back chapter figures
Figure 6.13
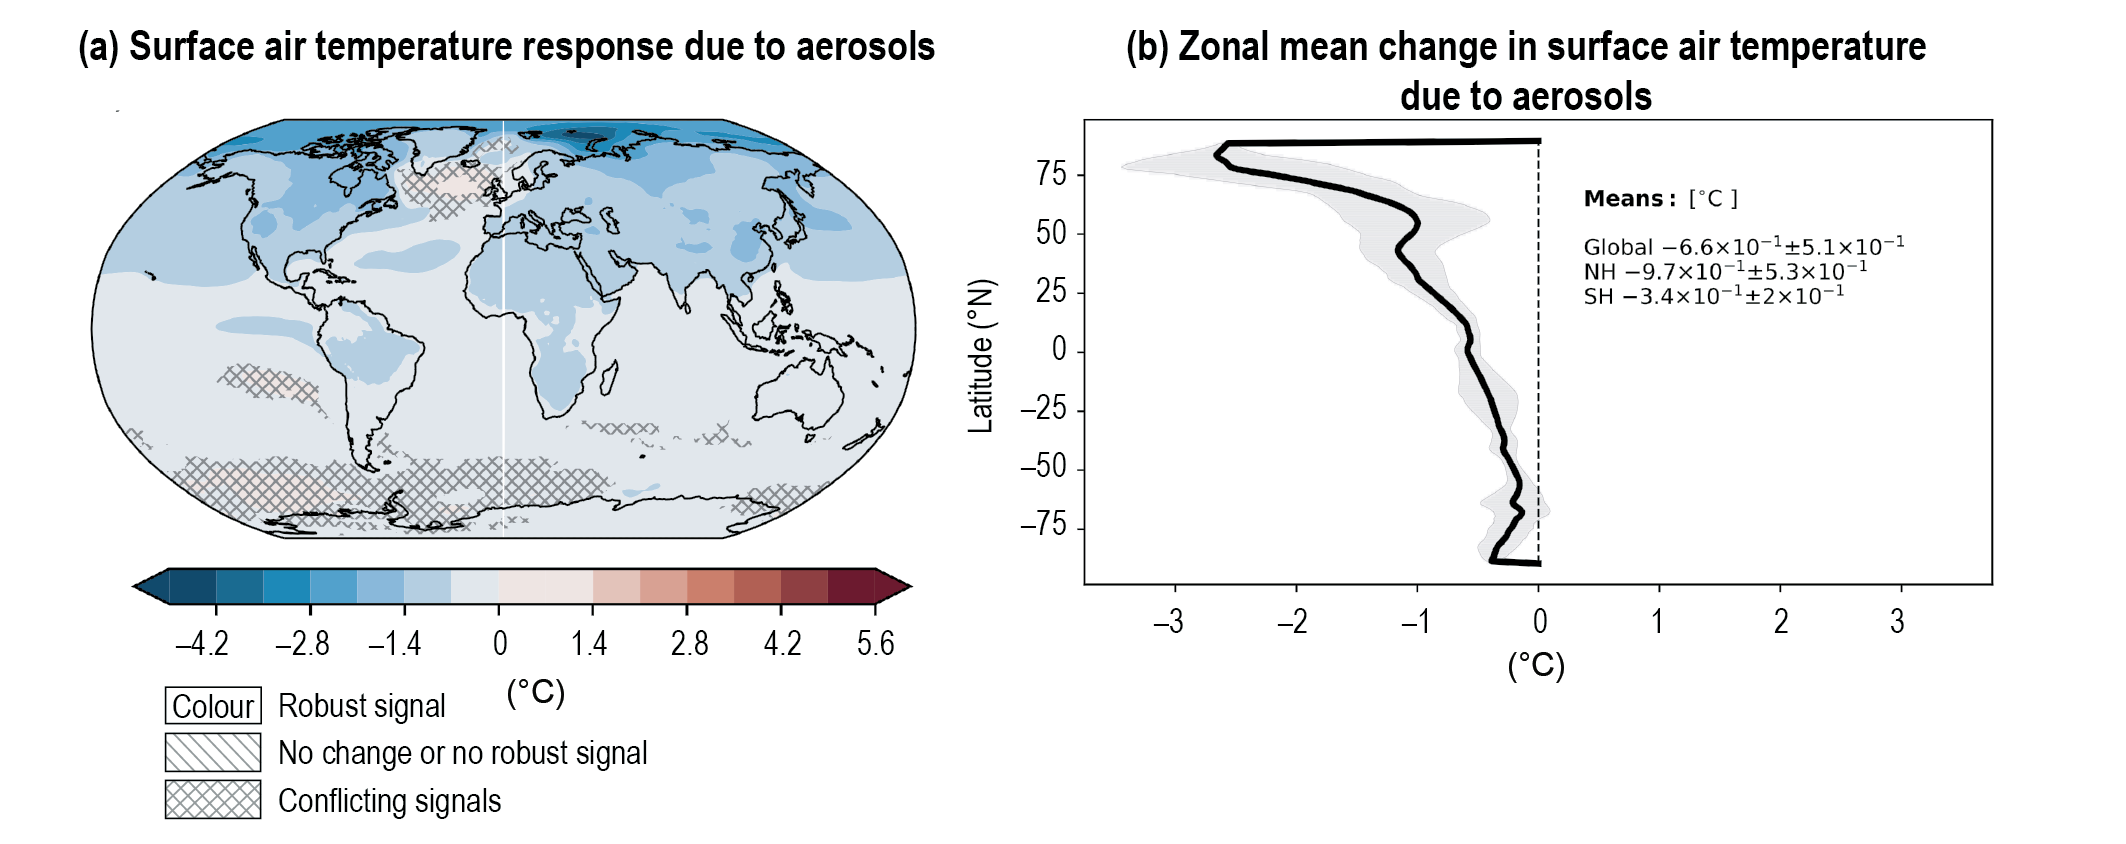
Figure caption
Figure 6.13 | Multi-model mean surface air temperature response over the recent past (1995–2014) induced by aerosol changes since 1850. Calculation is based on the difference between CMIP6 ‘historical’ and AerChemMIP ‘hist-piAer’ experiments averaged over 1995–2014, where (a) is the spatial pattern of the annual mean surface air temperature response, and (b) is the mean zonally averaged response. Model means are derived from the years 1995–2014. Uncertainty is represented using the advanced approach: No overlay indicates regions with robust signal, where ≥66% of models show change greater than variability threshold and ≥80% of all models agree on sign of change; diagonal lines indicate regions with no change or no robust signal, where <66% of models show a change greater than the variability threshold; crossed lines indicate regions with conflicting signal, where ≥66% of models show change greater than variability threshold and <80% of all models agree on sign of change. For more information on the advanced approach, please refer to the Cross-Chapter Box Atlas.1. AerChemMIP models MIROC6, MRI-ESM2-0, NorESM2-LM, GFDL-ESM4, GISS-E2-1-G and UKESM1-0-LL are used in the analysis. Further details on data sources and processing are available in the chapter data table (Table 6.SM.3).