Back chapter figures
Figure 6.14
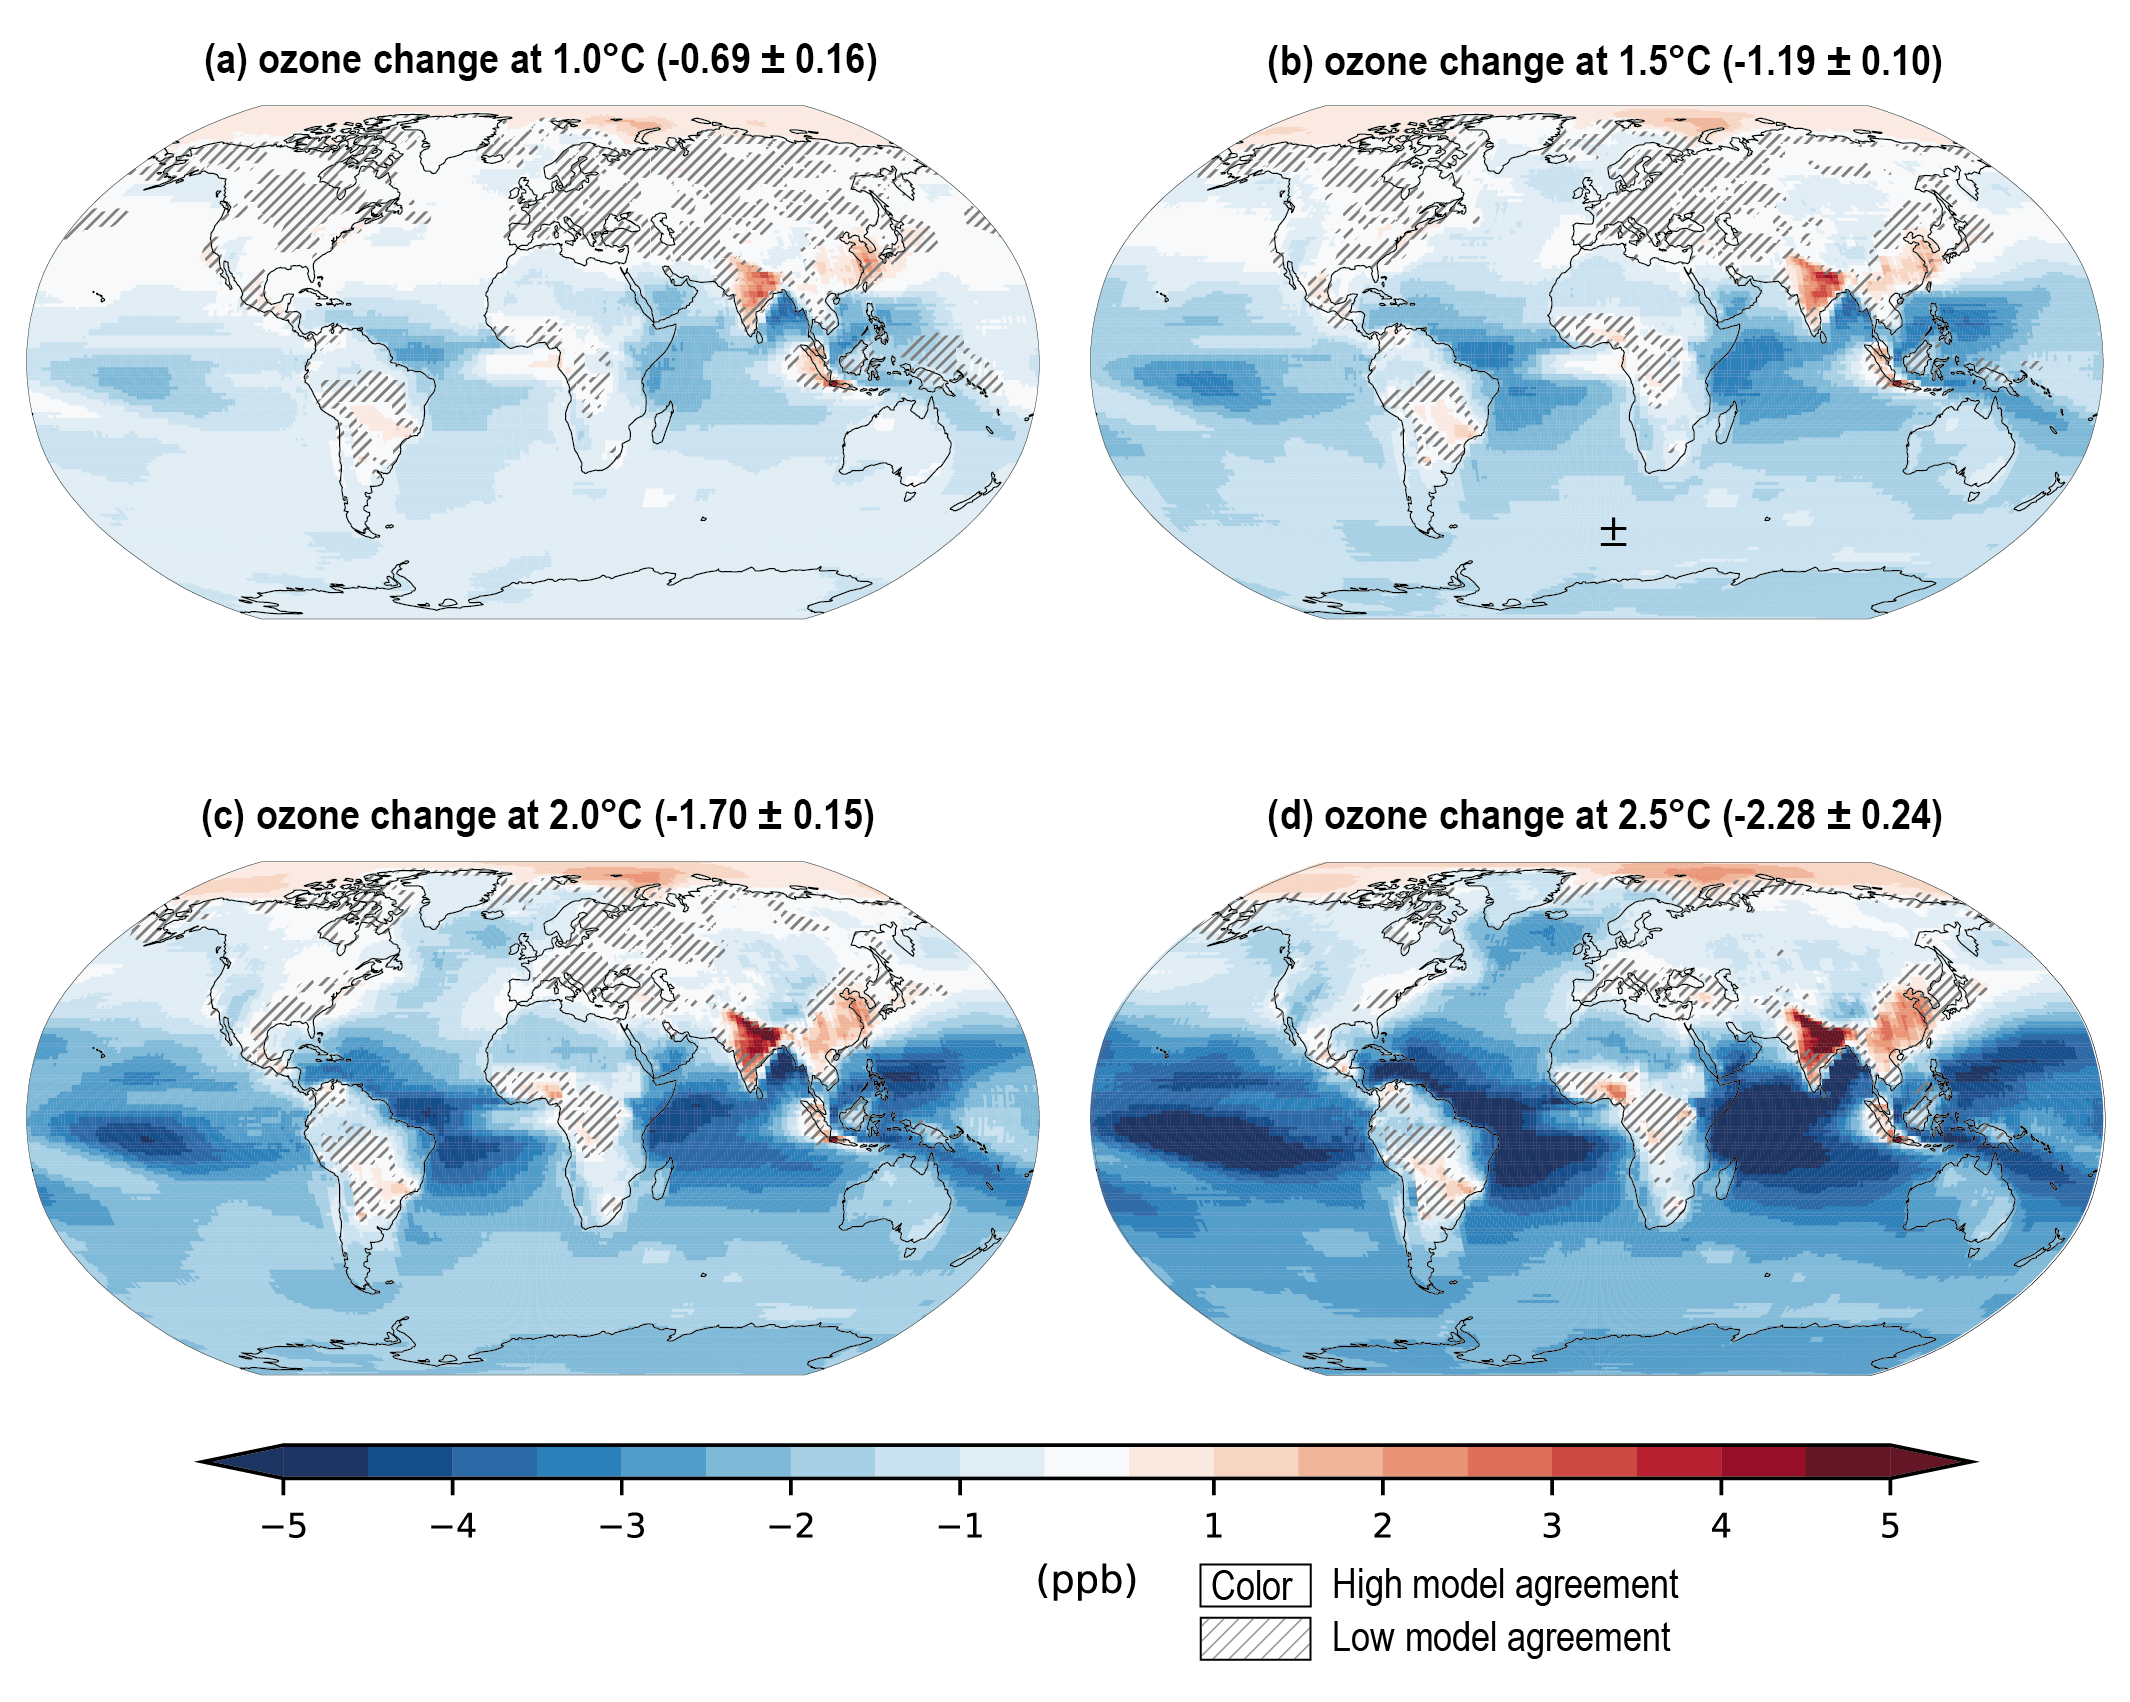
Figure caption
Figure 6.14 | Multi-model annual mean change in surface O3(ppb) concentrations at different warming levels. Changes are shown for (a) 1.0°C, (b) 1.5°C, (c) 2.0°C and (d) 2.5°C increases in global mean surface air temperature. CMIP6 models include GFDL-ESM4, GISS-E2-1-G, MRI-ESM2-0 and UKESM1-0-LL. For each model, the change in surface O3 is calculated as the difference between two AerChemMIP experiments – one with evolving future emissions and sea surface temperatures (SSTs) under the SSP3-7.0 scenario and the other with the same setup but with fixed present-day SSTs. The difference is calculated as a 20-year mean in surface O3 around the year when the temperature threshold in each model is exceeded. The multi-model change in global annual mean surface O3 concentrations with ± 1standard deviation are shown within parentheses. Uncertainty is represented using the simple approach: no overlay indicates regions with high model agreement, three out of four models agree on sign of change; diagonal lines indicate regions with low model agreement, where three out of four models agree on sign of change. For more information on the simple approach, please refer to the Cross-Chapter Box Atlas.1. Further details on data sources and processing are available in the chapter data table (Table 6.SM.3).