Back chapter figures
Figure 6.17
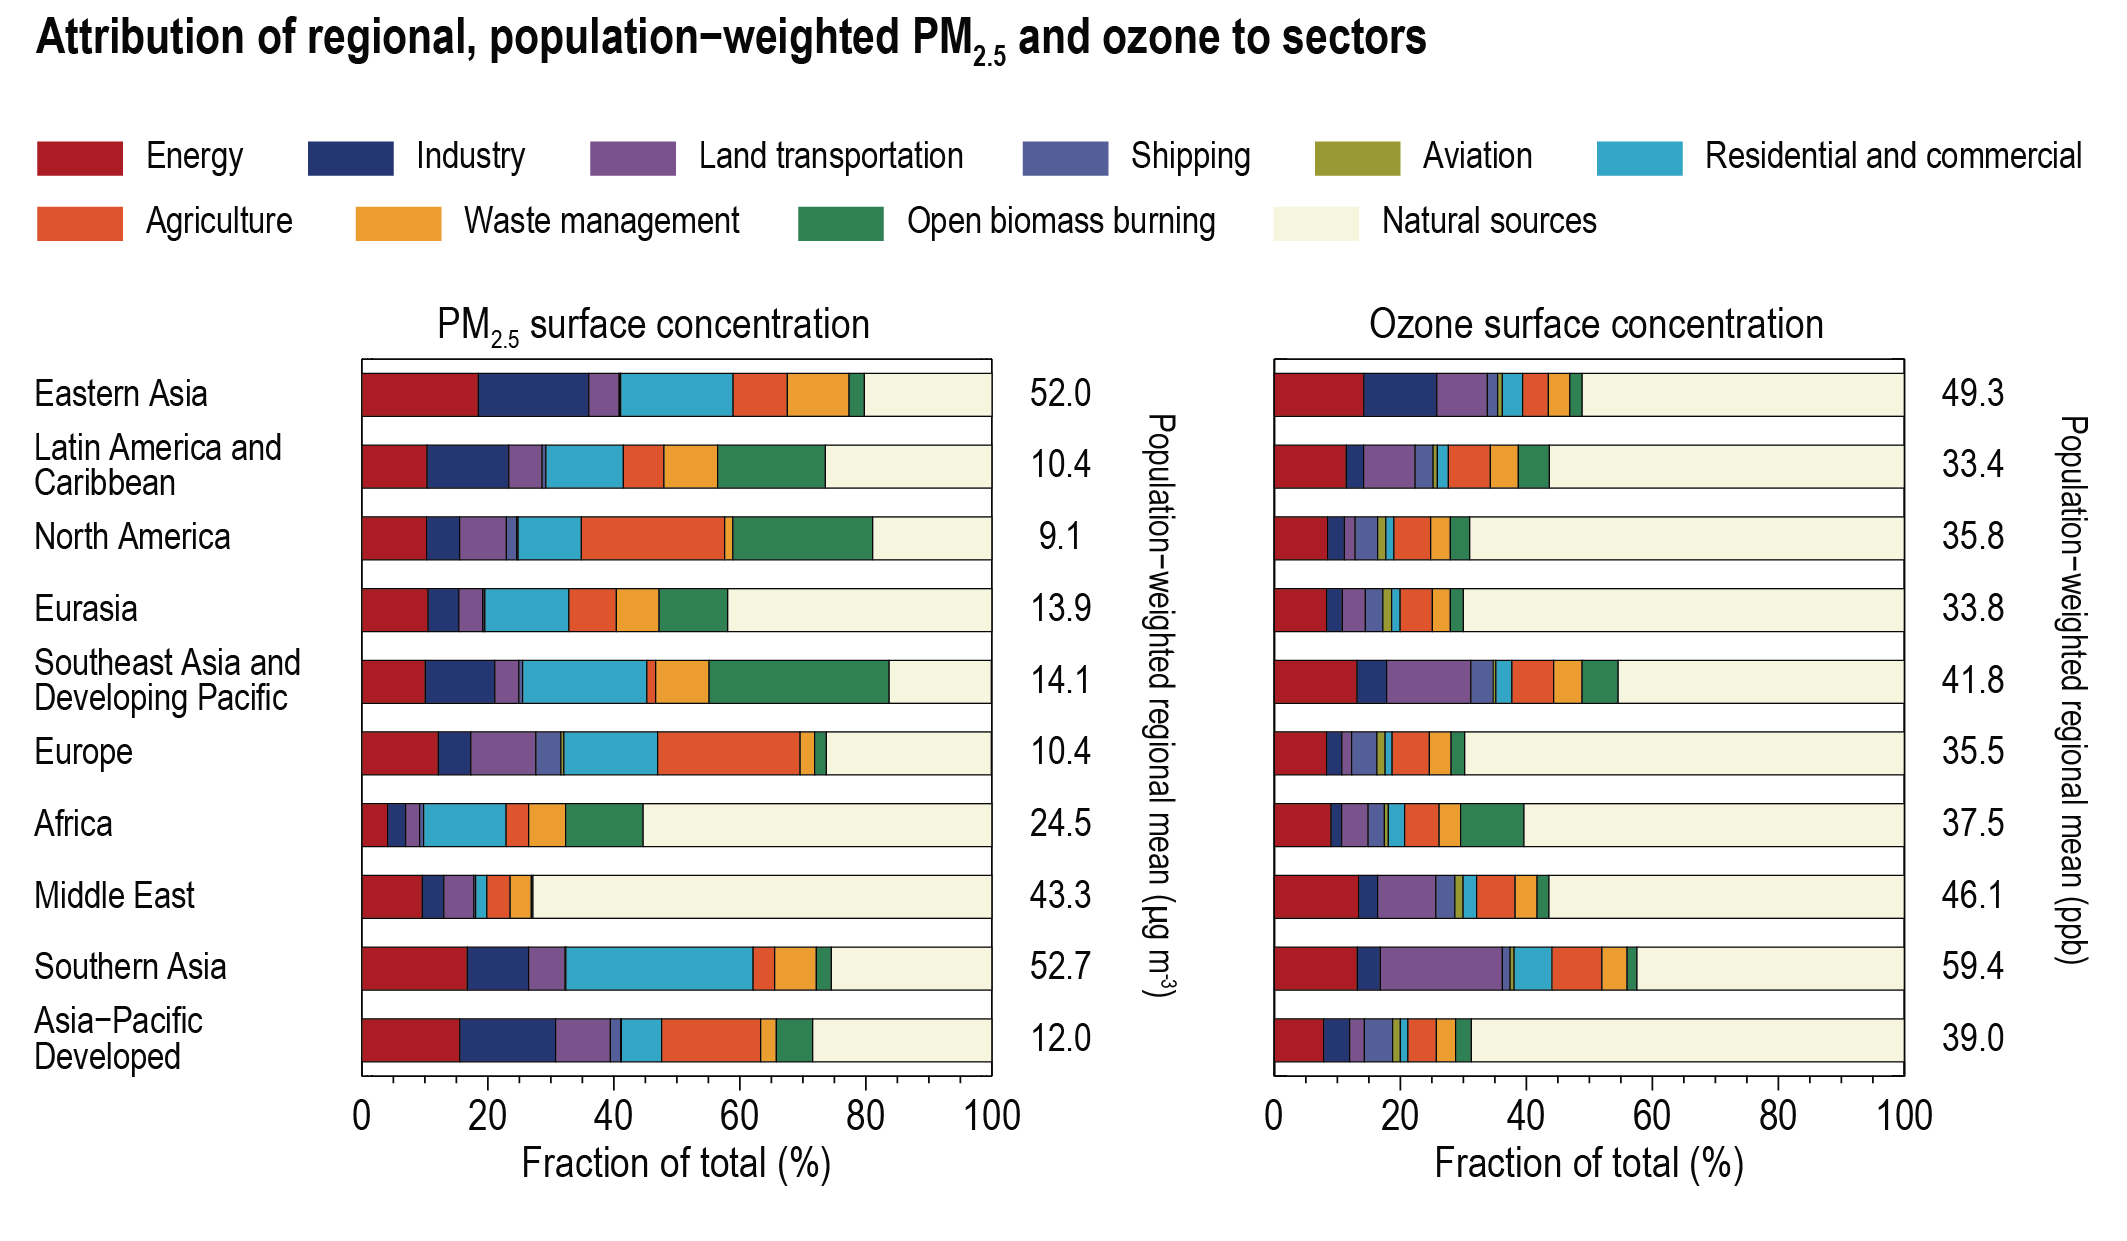
Figure caption
Figure 6.17 | Emissions source-sector attribution of regional population-weighted mean concentrations of PM2.5and ozone for present-day emissions (year 2014). Regional concentrations and source apportionment are calculated with the TM5-FASST model (Van Dingenen et al., 2018) for the 2014 emissions data from the Community Emissions Data System (CEDS) (Hoesly et al., 2018) and van Marle et al. (2017) for open-biomass burning. Dust and sea salt contributions to PM2.5 are monthly mean climatological averages over 2010–2018 from CAMS global reanalysis (EAC4) (Inness et al., 2019), generated using Copernicus Climate Change Service information (January 2020). Anthropogenic sectors are similar to those in Figures 6.2 and 6.16, except the grouping of fossil fuel production, distribution and combustion for energy under ‘Energy’ and the grouping of use of fossil fuel and biofuel use for cooking and heating under ‘Residential and Commercial’. Further details on data sources and processing are available in the chapter data table (Table 6.SM.3).