Back chapter figures
Figure 6.4
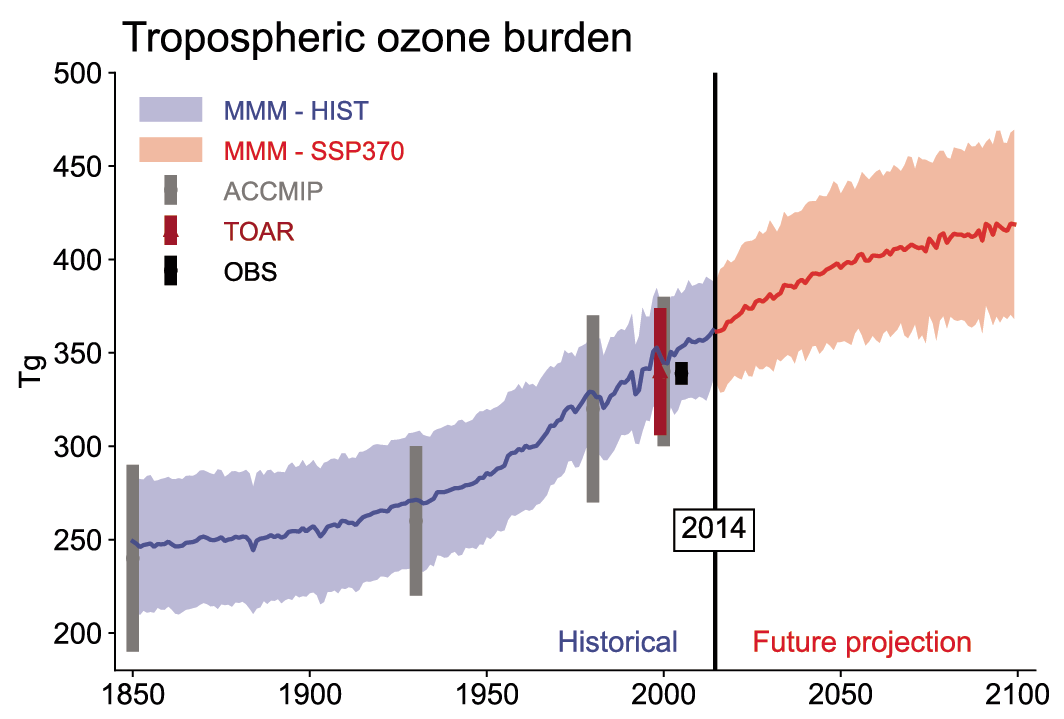
Figure caption
Figure 6.4 | Time evolution of global annual mean tropospheric ozone burden (in Tg) from 1850 to 2100. Multi-model means for CMIP6 historical experiment (1850–2014) from UKESM1-LL-0, CESM2-WACCM, MRI-ESM2-0, GISS-E2.1-G and GFDL-ESM4 and for ScenarioMIP SSP3-7.0 experiment (2015–2100) are represented with their inter-model standard deviation (±1 standard deviation, shaded areas). Observation-based global tropospheric ozone burden estimate (from Table 6.3) is for 2010–2014. Tropospheric Ozone Assessment Report (TOAR) multi-model mean value (from Table 6.3) is for 2000 with a ±1 standard deviation error-bar. Atmospheric Chemistry and Climate Model Intercomparison Project (ACCMIP) multi-model means are for 1850, 1930, 1980 and 2000 time slices with ±1 standard deviation error-bars. The troposphere is masked by the tropopause pressure calculated in each model using the WMO thermal tropopause definition. Further details on data sources and processing are available in the chapter data table (Table 6.SM.3).