Back chapter figures
Figure 6.6
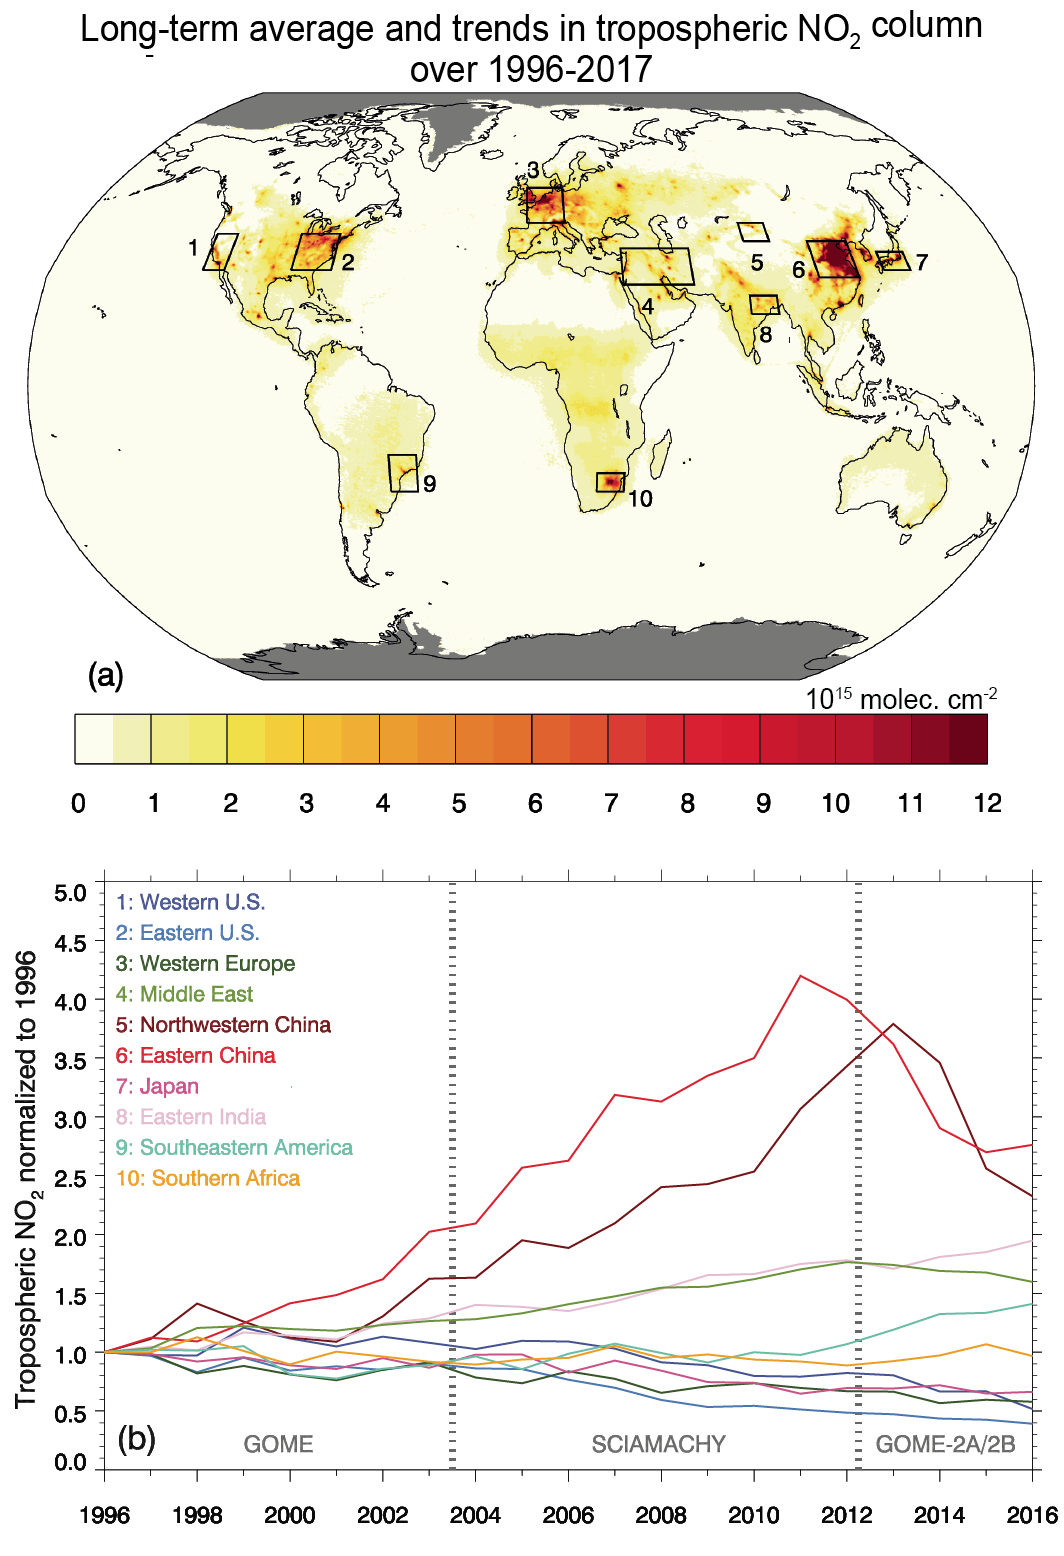
Figure caption
Figure 6.6 | Long-term climatological mean (a) and time evolution (b) of tropospheric nitrogen dioxide (NO2) vertical column density. Data are from the merged GOME/SCIAMACHY/GOME-2 (TM4NO2A version 2.3) dataset for the period 1996–2016 (Georgoulias et al., 2019). Time evolution of NO2 column shown in panel (b) is normalized to the fitted 1996 levels for the 10 regions shown as boxes in panel (a). Further details on data sources and processing are available in the chapter data table (Table 6.SM.3).