Back chapter figures
Figure 6.7
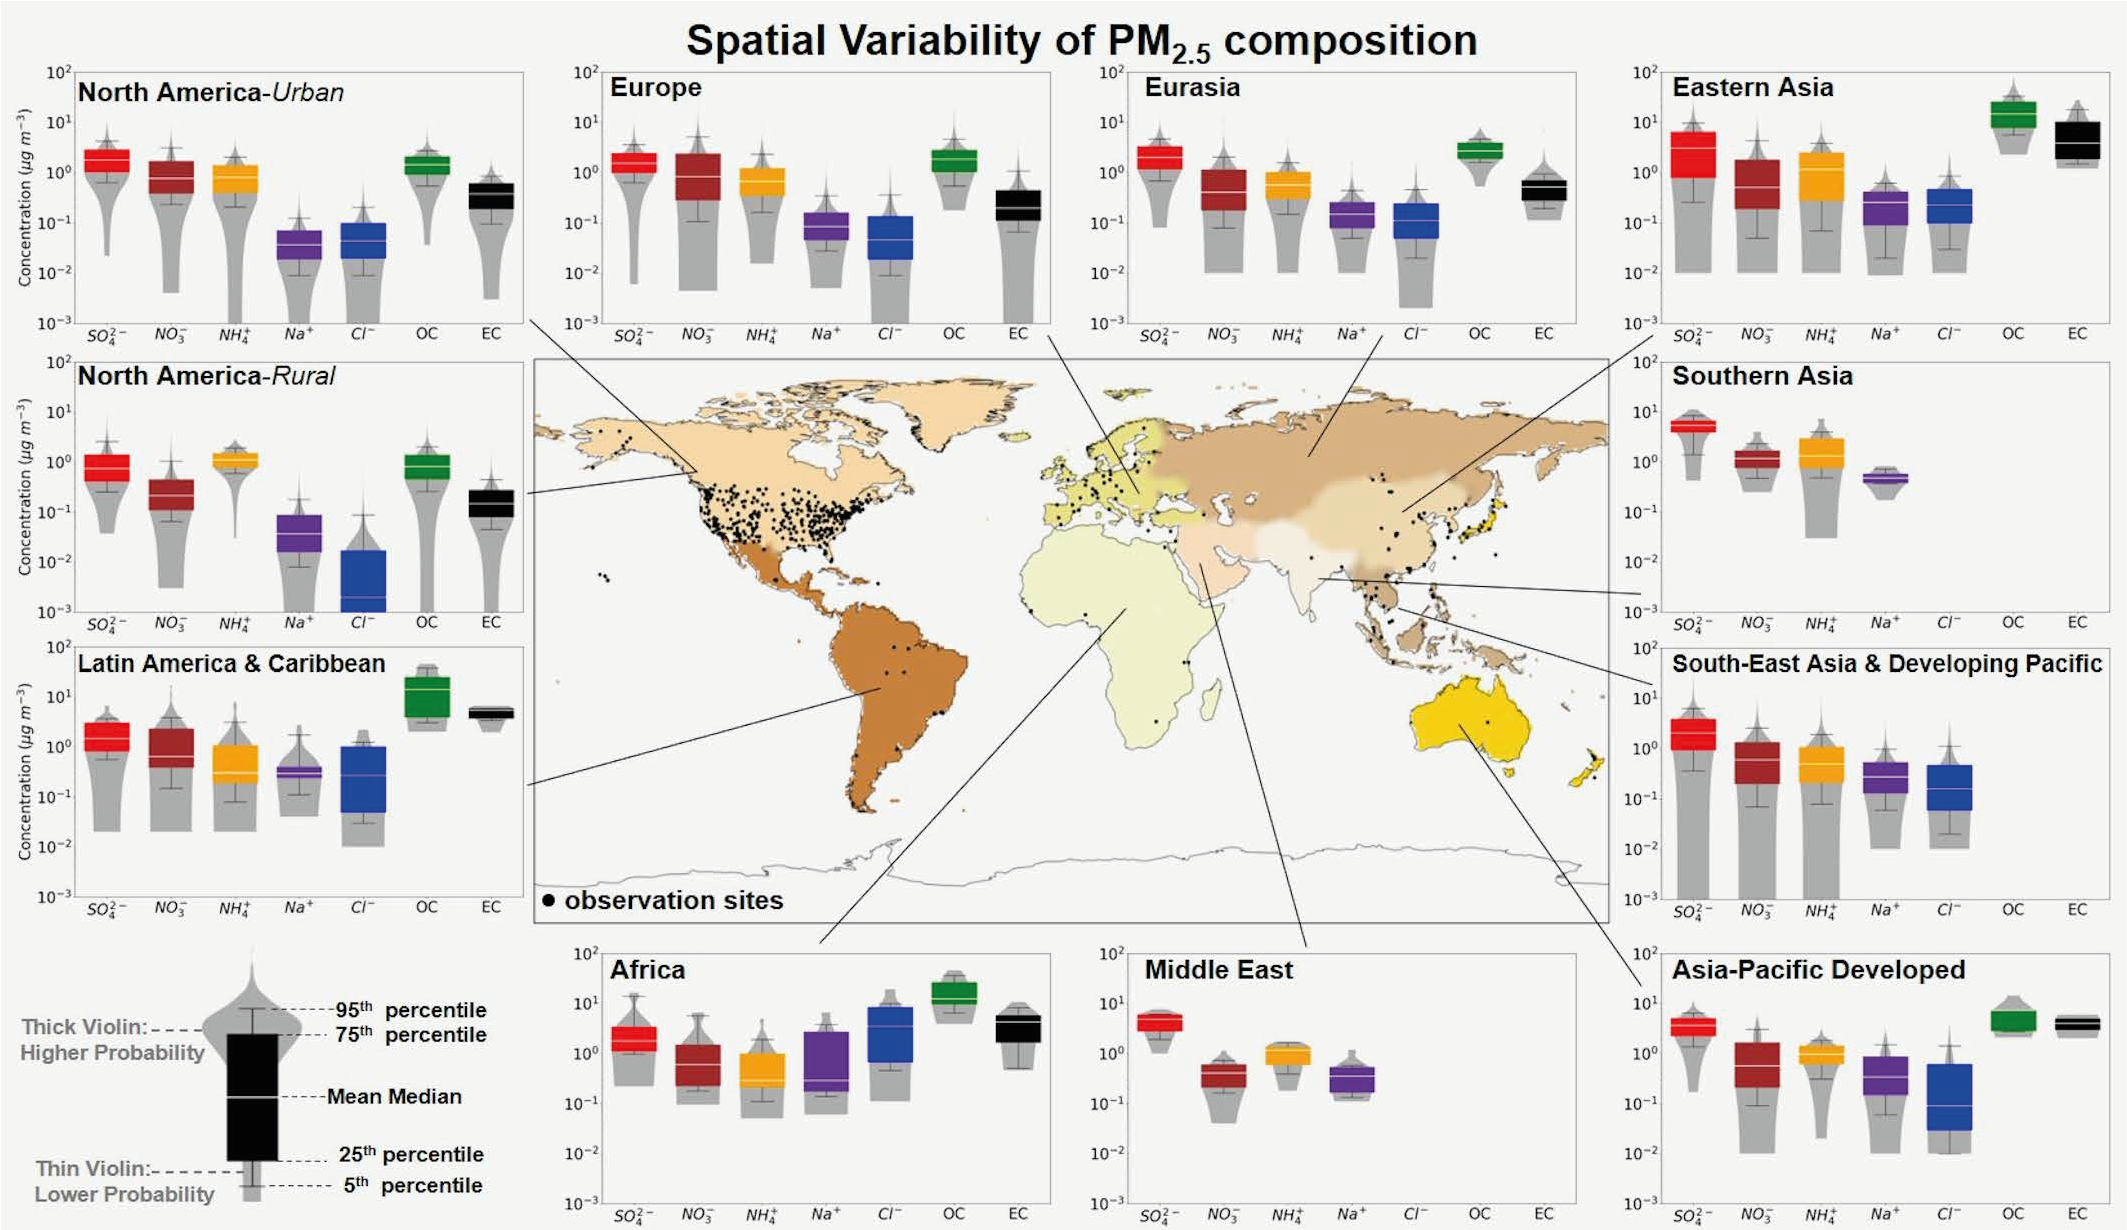
Figure caption
Figure 6.7 | Distribution of PM2.5composition mass concentration (in μg m–3) for the major PM2.5aerosol components. Those aerosol components are sulphate, nitrate, ammonium, sodium, chloride, organic carbon and elemental carbon. The central world map depicts the intermediate-level regional breakdown of observations (10 regions) following the IPCC Sixth Assessment Report Working Group III (AR6 WGIII). Monthly averaged PM2.5 aerosol component measurements are from: (i) the Environmental Protection Agency (EPA) network which include 211 monitor sites primarily in urban areas of North America during 2000–2018 (Solomon et al., 2014), (ii) the Interagency Monitoring of Protected Visual Environments (IMPROVE) network during 2000–2018 over 198 monitoring sites representative of the regional haze conditions over North America, (iii) the European Monitoring and Evaluation Programme (EMEP) network over 70 monitoring in Europe and (eastern) Eurasia during 2000–2018, (iv) the Acid Deposition Monitoring Network in Eastern Asia (EANET) network with 39 (18 remote, 10 rural, 11 urban) sites in Eurasia, Eastern Asia, South East Asia and Developing Pacific, and Asia-Pacific Developed during 2001–2017, (v) the global Surface Particulate Matter Network (SPARTAN) during 2013–2019 with sites primarily in highly populated regions around the world (i.e., North America, Latin America and Caribbean, Africa, Middle East, Southern Asia, Eastern Asia, South East Asia and Developing Pacific; Snider et al., 2015, 2016), and (vii) individual observational field campaign averages over Latin America and Caribbean, Africa, Europe, Eastern Asia, and Asia-Pacific Developed (Celis et al., 2004; Feng et al., 2006; Bourotte et al., 2007; Fuzzi et al., 2007; Mariani and de Mello, 2007; Molina et al., 2007, 2010; Favez et al., 2008; Mkoma, 2008; Aggarwal and Kawamura, 2009; Mkoma et al., 2009; de Souza et al., 2010; Li et al., 2010; Martin et al., 2010; Radhi et al., 2010; Weinstein et al., 2010; Batmunkh et al., 2011; Gioda et al., 2011; Pathak et al., 2011; F. Zhang et al., 2012; Cho and Park, 2013; Zhao et al., 2013; Wang et al., 2019; Kuzu et al., 2020). Further details on data sources and processing are available in the chapter data table (Table 6.SM.3).