Back chapter figures
Figure 6.8
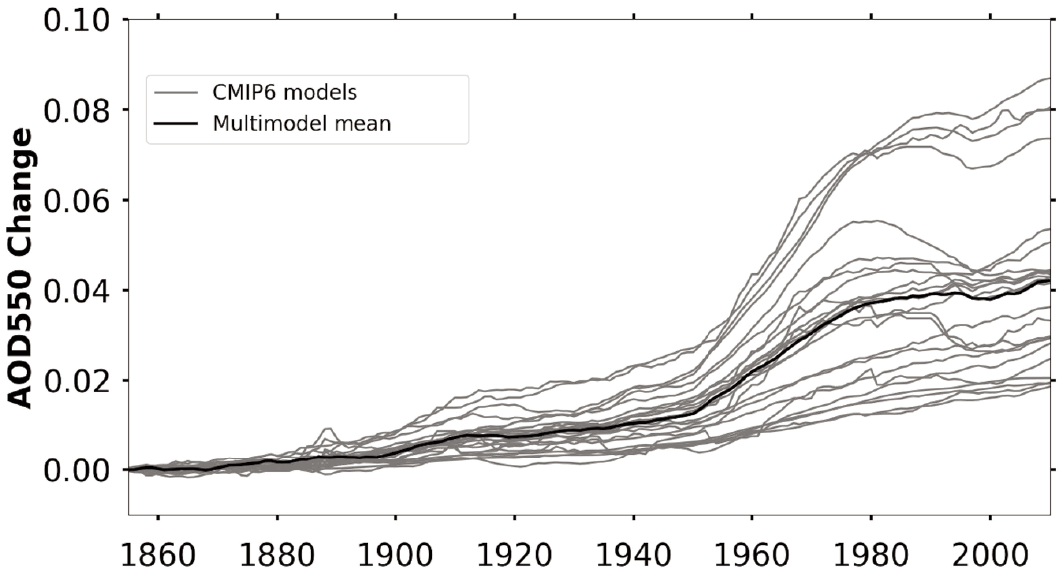
Figure caption
Figure 6.8 | Time evolution of changes in global mean aerosol optical depth (AOD) at 550 nm. The year of reference is 1850. Data are shown from individual Coupled Model Intercomparison Project Phase 6 (CMIP6) historical simulations. Each time series corresponds to the ensemble mean of realizations done by each model. Simulation results from years including major volcanic eruptions (e.g., Novarupta, 1912; Pinatubo, 1991), are excluded from the analysis for models encompassing the contribution of stratospheric volcanic aerosols to total AOD. Further details on data sources and processing are available in the chapter data table (Table 6.SM.3).