Box 7.1, Figure 1
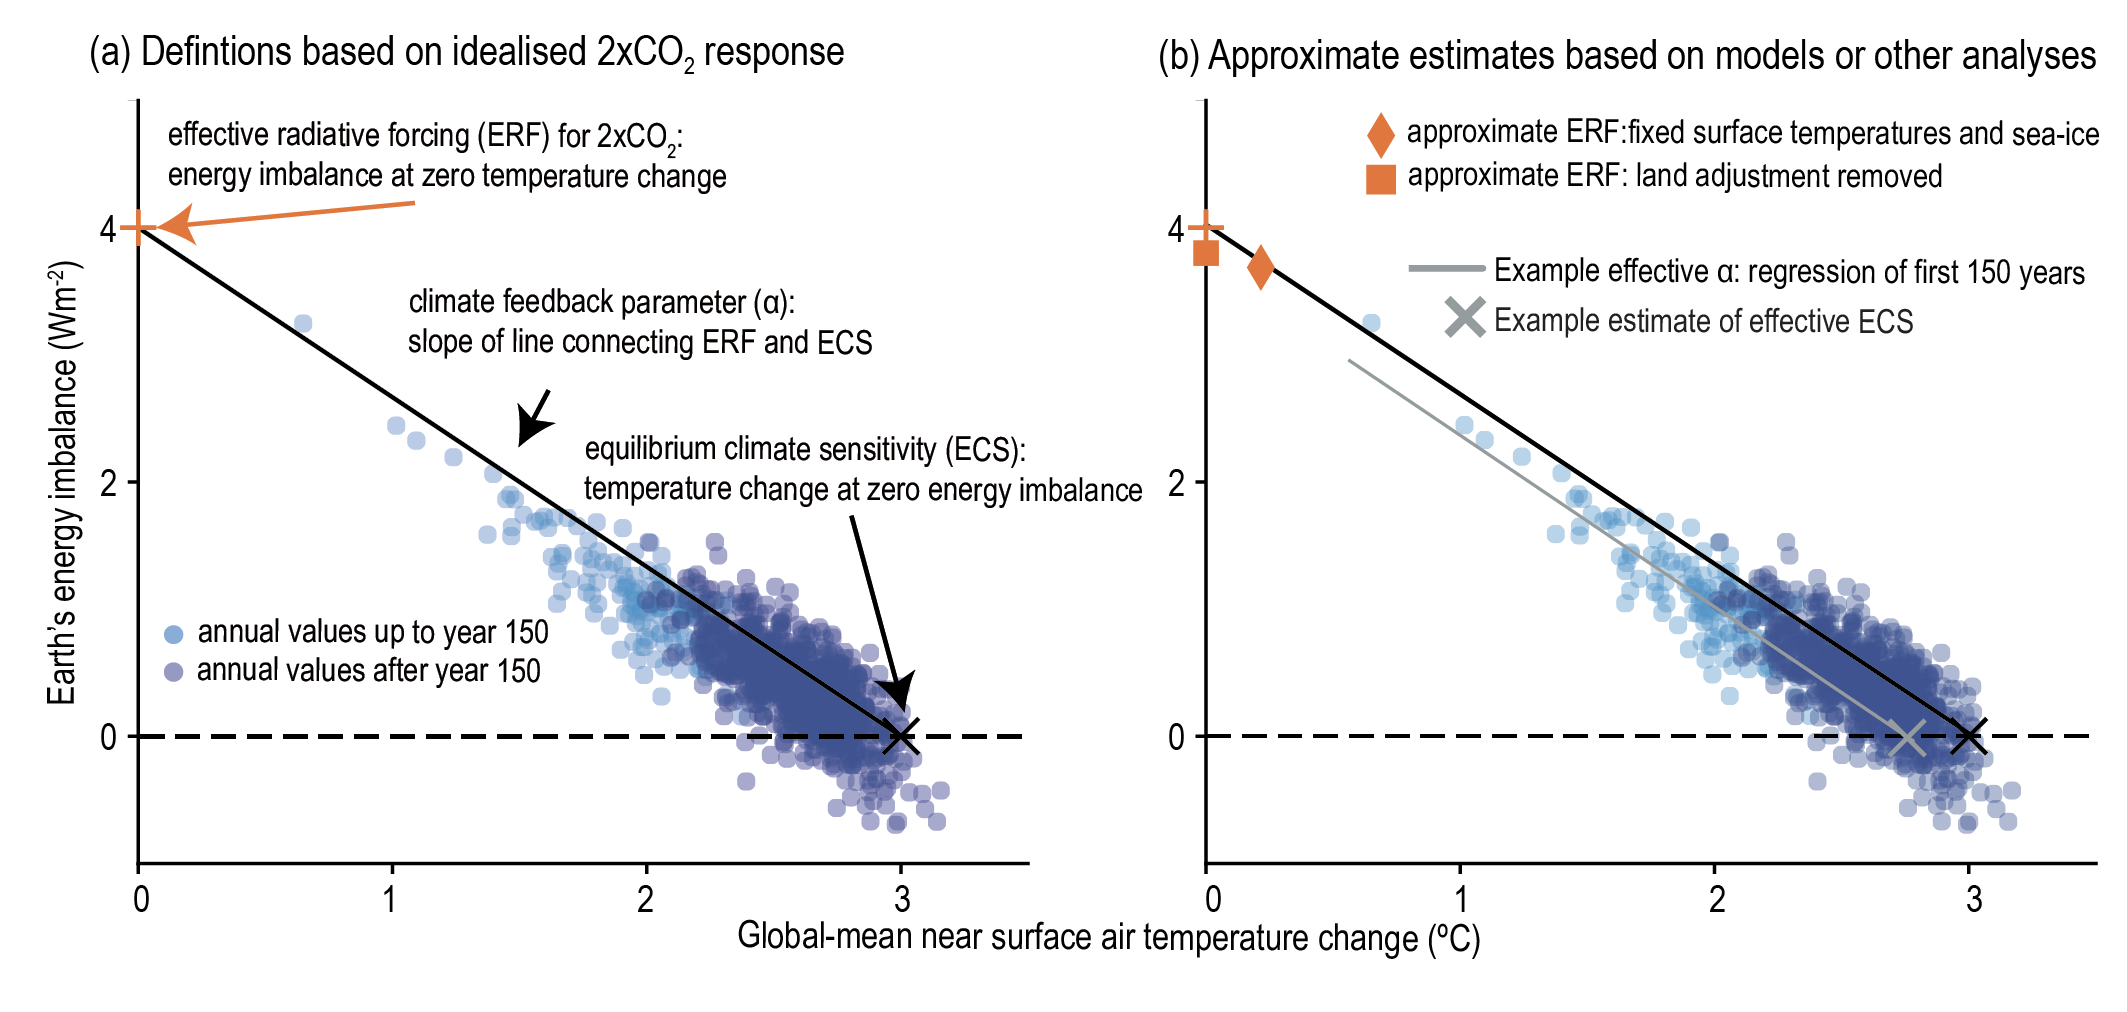
Figure caption
Box 7.1, Figure 1 | Schematics of the forcing–feedback framework adopted within the assessment, following Equation 7.1. The figure illustrates how the Earth’s top-of-atmosphere (TOA) net energy flux might evolve for a hypothetical doubling of atmospheric CO2 concentration above pre-industrial levels, where an initial positive energy imbalance (energy entering the Earth system, shown on the y-axis) is gradually restored towards equilibrium as the surface temperature warms (shown on the x-axis). (a) illustrates the definitions of effective radiative forcing (ERF) for the special case of a doubling of atmospheric CO2 concentration, the feedback parameter and the equilibrium climate sensitivity (ECS). (b) illustrates how approximate estimates of these metrics are made within the chapter and how these approximations might relate to the exact definitions adopted in panel (a).