Back chapter figures
FAQ 7.3 Figure 1
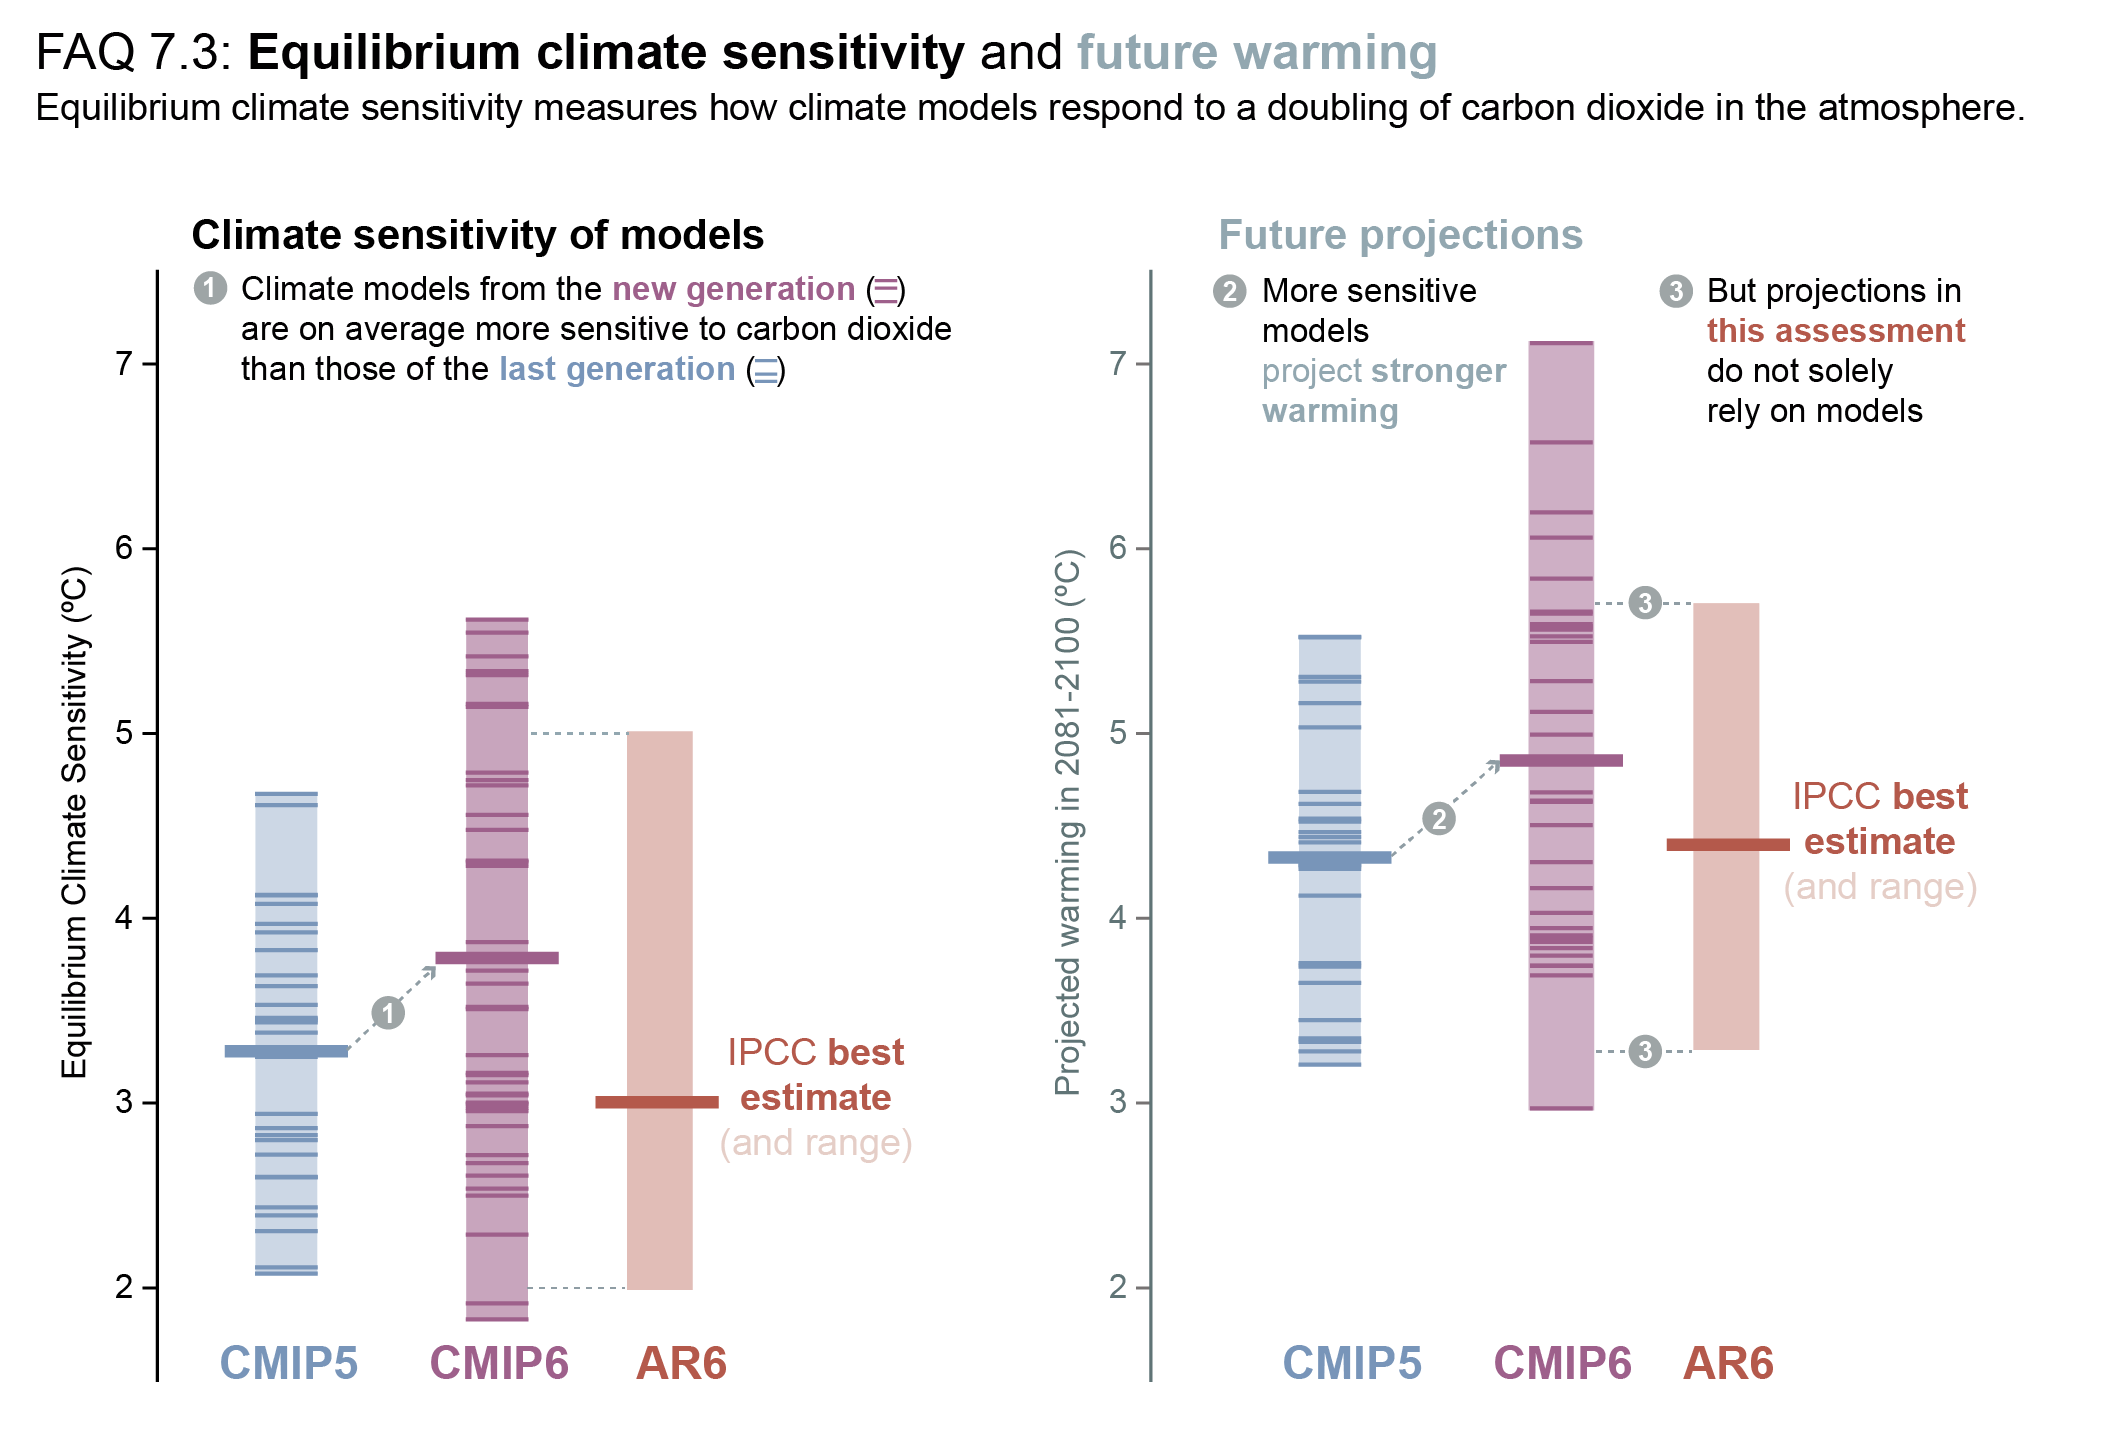
Figure caption
FAQ 7.3, Figure 1 | Equilibrium climate sensitivity and future warming. (left) Equilibrium climate sensitivities for the current generation (Coupled Model Intercomparison Project Phase 6, CMIP6) climate models, and the previous (CMIP5) generation. The assessed range in this Report (AR6) is also shown. (right) Climate projections of CMIP5, CMIP6 and AR6 for the very high-emissions scenarios RCP8.5, and SSP5-8.5, respectively. The thick horizontal lines represent the multi-model average and the thin horizontal lines represent the results of individual models. The boxes represent the model ranges for CMIP5 and CMIP6 and the range assessed in AR6.