Back chapter figures
Figure 7.10
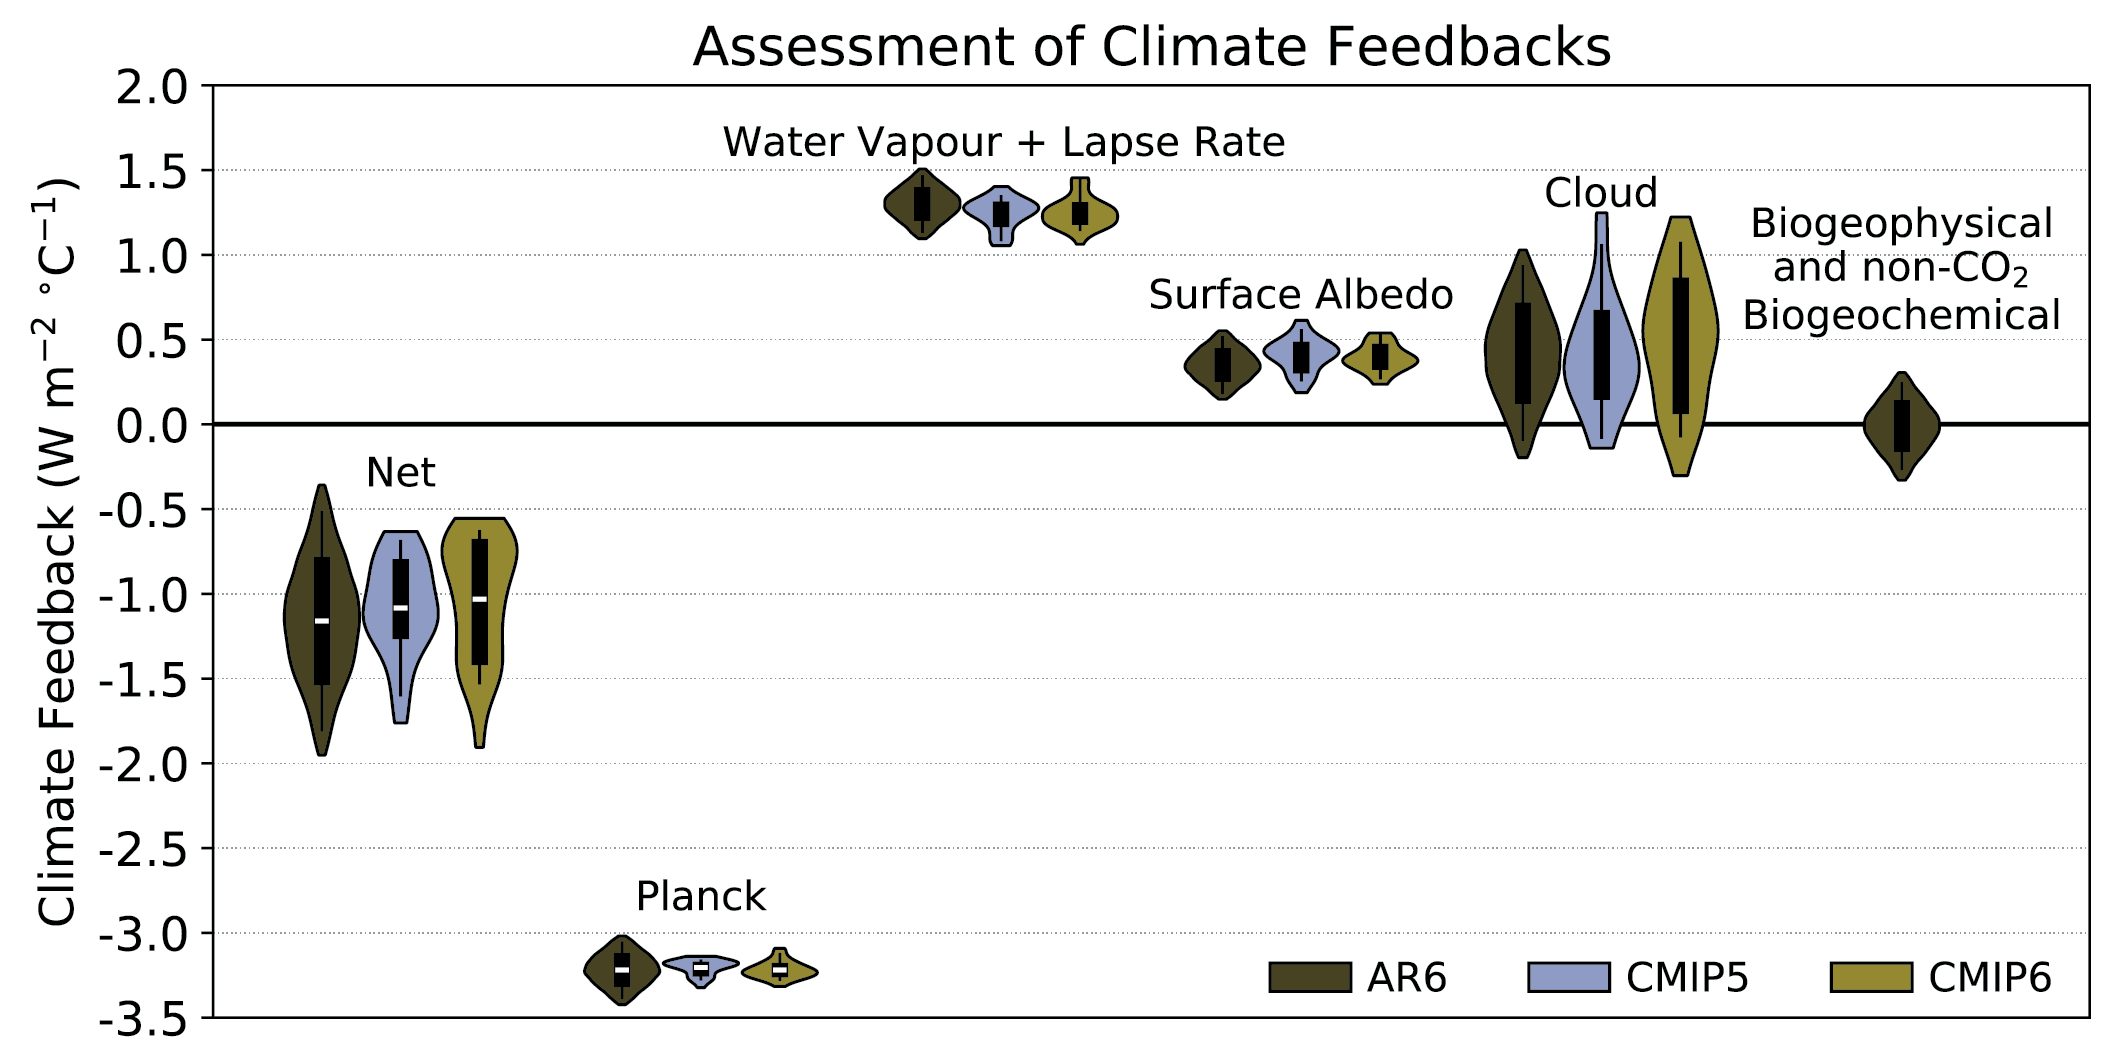
Figure caption
Figure 7.10 | Global mean climate feedbacks estimated in abrupt 4xCO2 simulations of 29 CMIP5 models (light blue) and 49 CMIP6 models (orange), compared with those assessed in this Report (red). Individual feedbacks for CMIP models are averaged across six radiative kernels as computed in Zelinka et al. (2020). The white line, black box and vertical line indicate the mean, 66% and 90% ranges, respectively. The shading represents the probability distribution across the full range of GCM/ESM values and for the 2.5–97.5 percentile range of the AR6 normal distribution. The unit is W m–2°C–1. Feedbacks associated with biogeophysical and non-CO2 biogeochemical processes are assessed in AR6, but they are not explicitly estimated from general circulation models (GCMs)/Earth system models (ESMs) in CMIP5 and CMIP6. Further details on data sources and processing are available in the chapter data table (Table 7.SM.14).