Back chapter figures
Figure 7.11
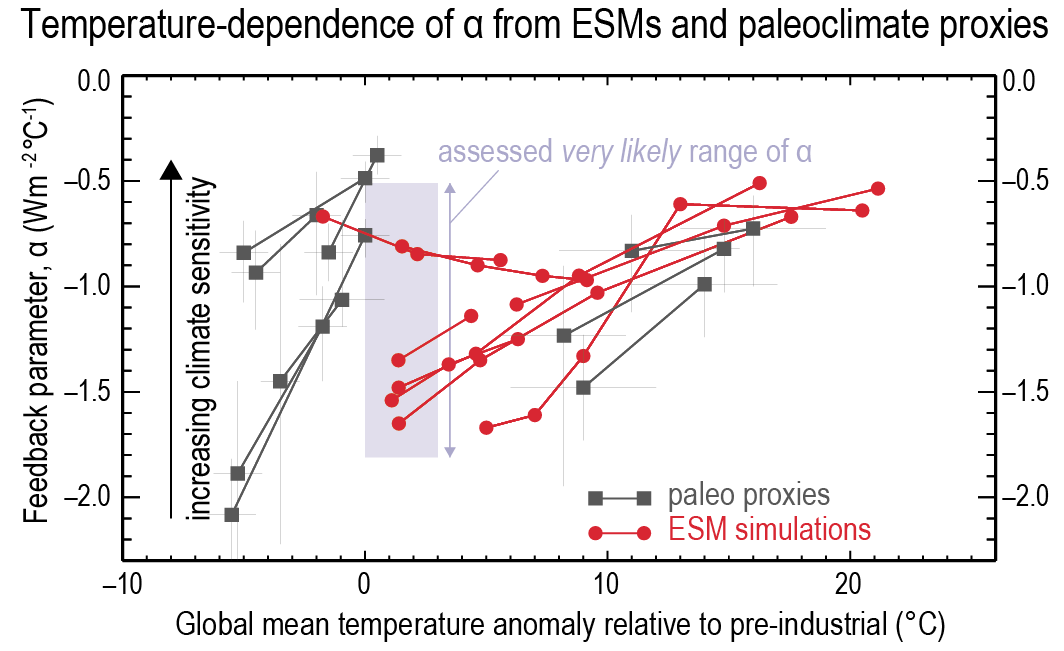
Figure caption
Figure 7.11 | Feedback parameter, α (W m–2°C–1), as a function of global mean surface air temperature anomaly relative to pre-industrial, for ESM simulations (red circles and lines) (Caballero and Huber, 2013; Jonko et al., 2013; Meraner et al., 2013; Good et al., 2015; Duan et al., 2019; Mauritsen et al., 2019; Stolpe et al., 2019; Zhu et al., 2019a), and derived from paleoclimate proxies (grey squares and lines) (von der Heydt et al., 2014; Anagnostou et al., 2016, 2020; Friedrich et al., 2016; Royer, 2016; Shaffer et al., 2016; Köhler et al., 2017; Snyder, 2019; Stap et al., 2019). For the ESM simulations, the value on The x-axis refers to the average of the temperature before and after the system has equilibrated to a forcing (in most cases a CO2 doubling), and is expressed as an anomaly relative to an associated pre-industrial global mean temperature from that model. The light blue shaded square extends across the assessed range of α (Table 7.10) on The y-axis, and on The x-axis extends across the approximate temperature range over which the assessment of α is based (taken as from zero to the assessed central value of ECS; see Table 7.13). Further details on data sources and processing are available in the chapter data table (Table 7.SM.14).