Back chapter figures
Figure 7.14
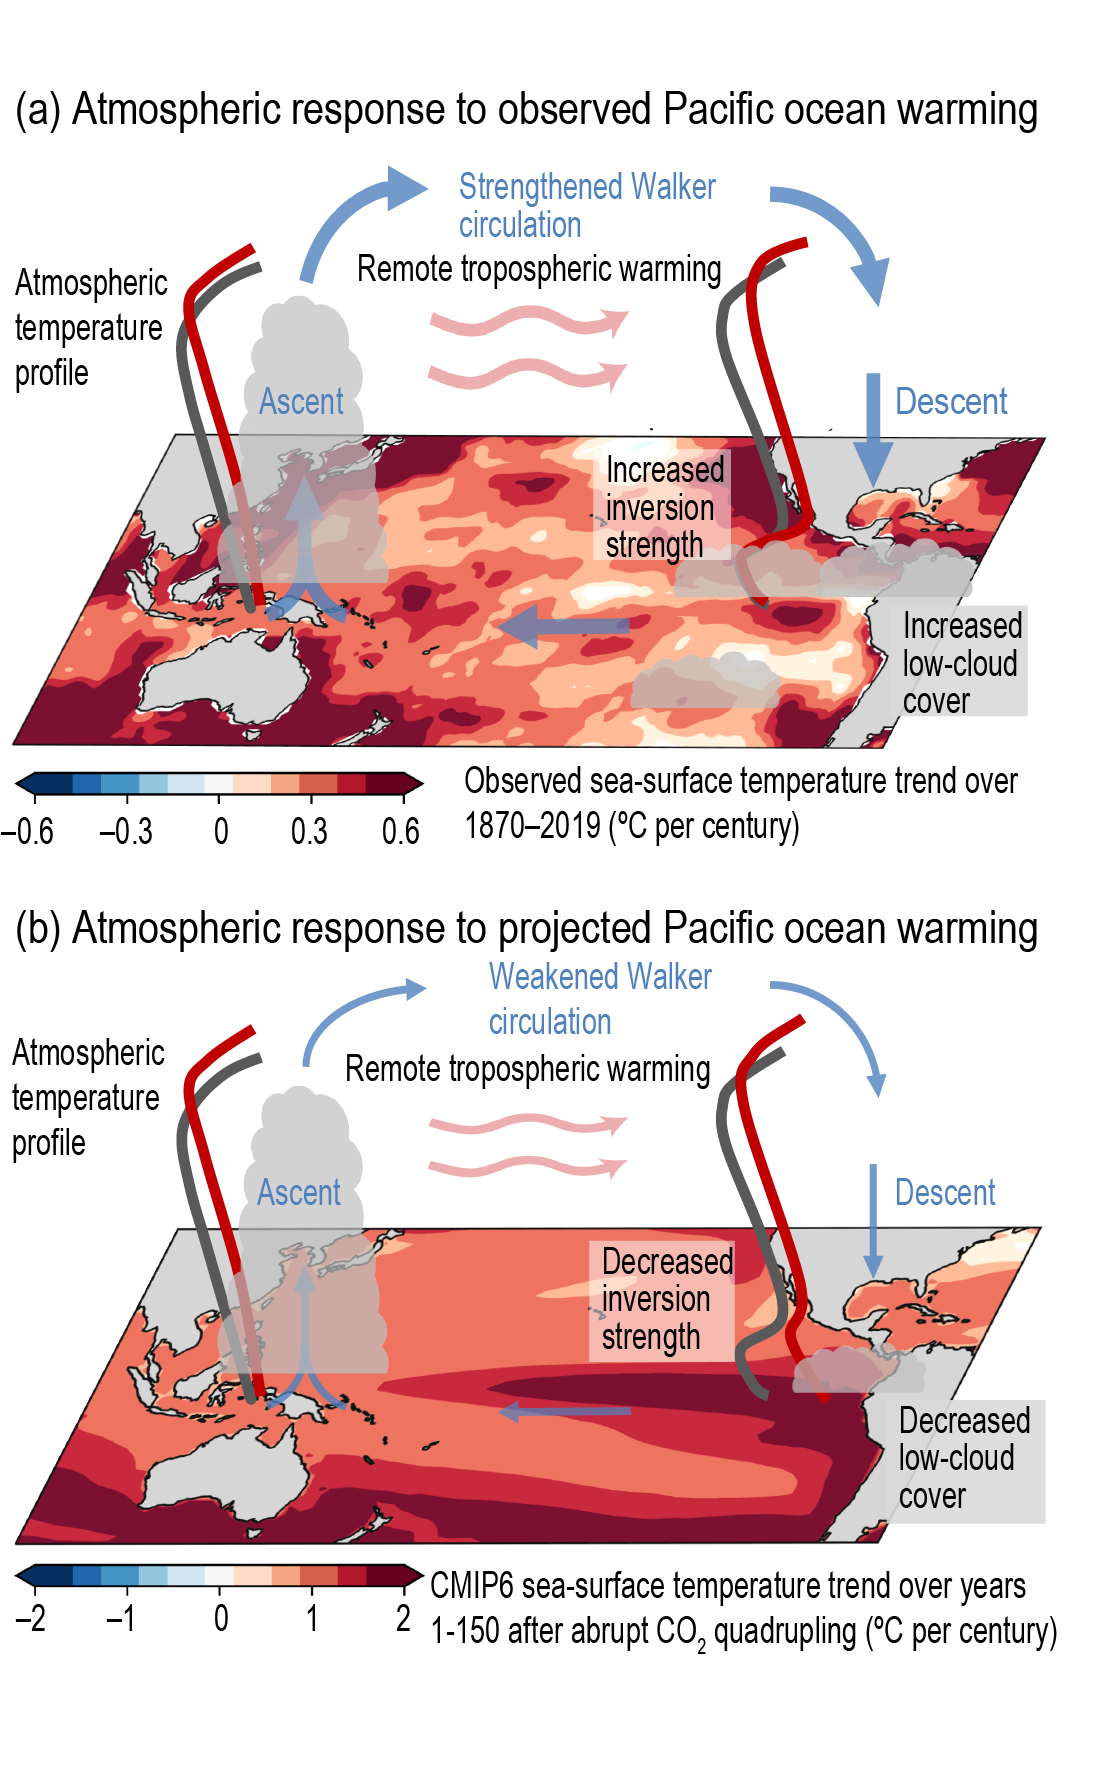
Figure caption
Figure 7.14 | Illustration of tropospheric temperature and low-cloud response to observed and projected Pacific Ocean sea surface temperature trends. (a) Atmospheric response to linear sea surface temperature trend observed over 1870–2019 (HadISST1 dataset; Rayner et al., 2003). (b) Atmospheric response to linear sea-surface temperature trend over 150 years followingabrupt 4xCO2 forcing as projected by CMIP6 ESMs (Dong et al., 2020). Relatively large historical warming in the western tropical Pacific has been communicated aloft (a shift from grey to red atmospheric temperature profile), remotely warming the tropical free troposphere and increasing the strength of the inversion in regions of the tropics where warming has been slower, such as the eastern equatorial Pacific. In turn, an increased inversion strength has increased the low-cloud cover (Zhou et al., 2016) causing an anomalously negative cloud and lapse-rate feedbacks over the historical record (Andrews et al., 2018; Marvel et al., 2018). Relatively large projected warming in the eastern tropical Pacific is trapped near the surface (shift from grey to red atmospheric temperature profile), decreasing the strength of the inversion locally. In turn, a decreased inversion strength combined with surface warming is projected to decrease the low-cloud cover, causing the cloud and lapse-rate feedbacks to become less negative in the future. Figure adapted from Mauritsen (2016). Further details on data sources and processing are available in the chapter data table (Table 7.SM.14).