Back chapter figures
Figure 7.17
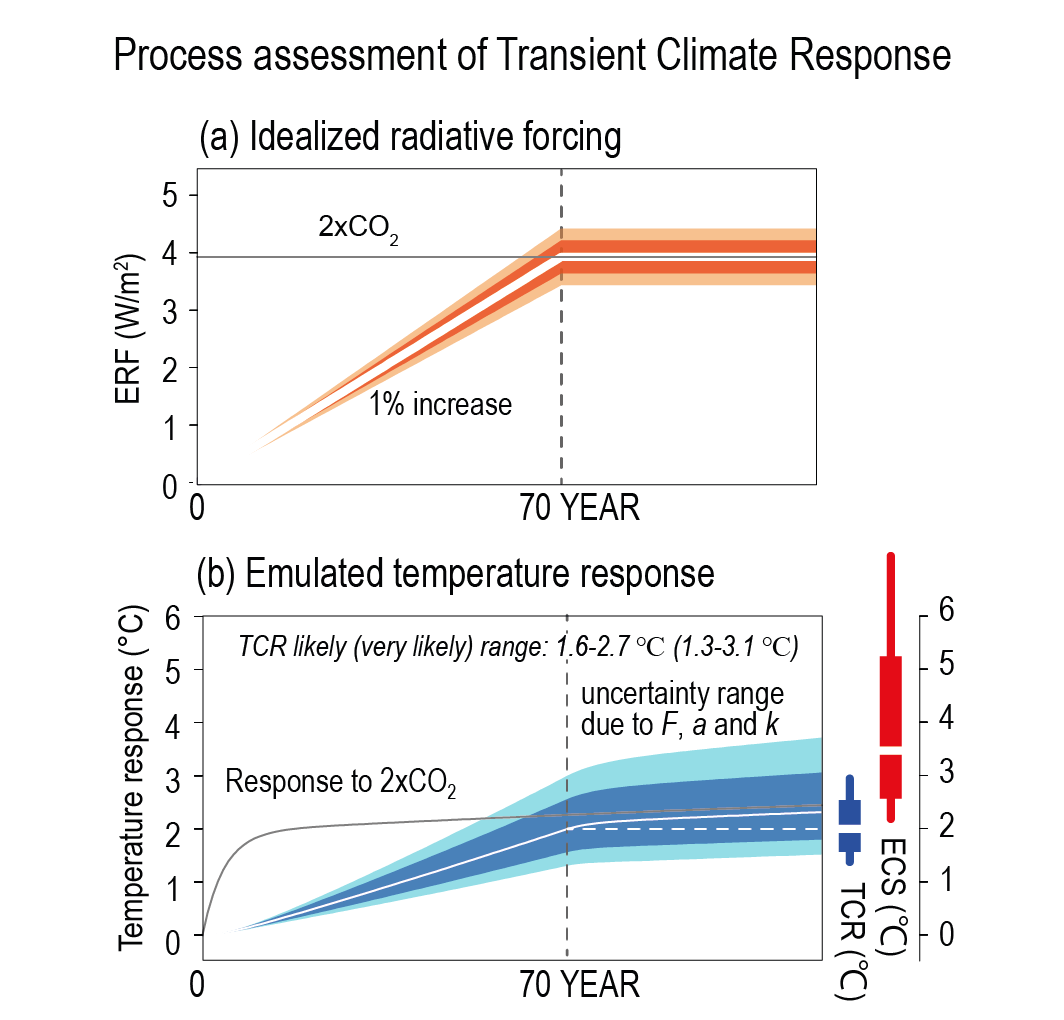
Figure caption
Figure 7.17 | (a) Time evolution of the effective radiative forcing (ERF) to the CO2 concentration increased by 1% per year until year 70 (equal to the time of doubling) and kept fixed afterwards (white line). The likely and very likely ranges of ERF indicated by light and dark orange have been assessed in Section 7.3.2.1. (b) Surface temperature response to the CO2 forcing calculated using the emulator with a given value of ECS, considering uncertainty in ΔF2×CO2, α , and κ associated with the ocean heat uptake and efficacy (white line). The likely and very likely ranges are indicated by cyan and blue, respectively. For comparison, the temperature response to abrupt doubling of the CO2 concentration is displayed by a grey curve. The mean, likely and very likely ranges of ECS and TCR are shown at the right (the values of TCR also presented in the panel). Further details on data sources and processing are available in the chapter data table (Table 7.SM.14).