Back chapter figures
Figure 7.21
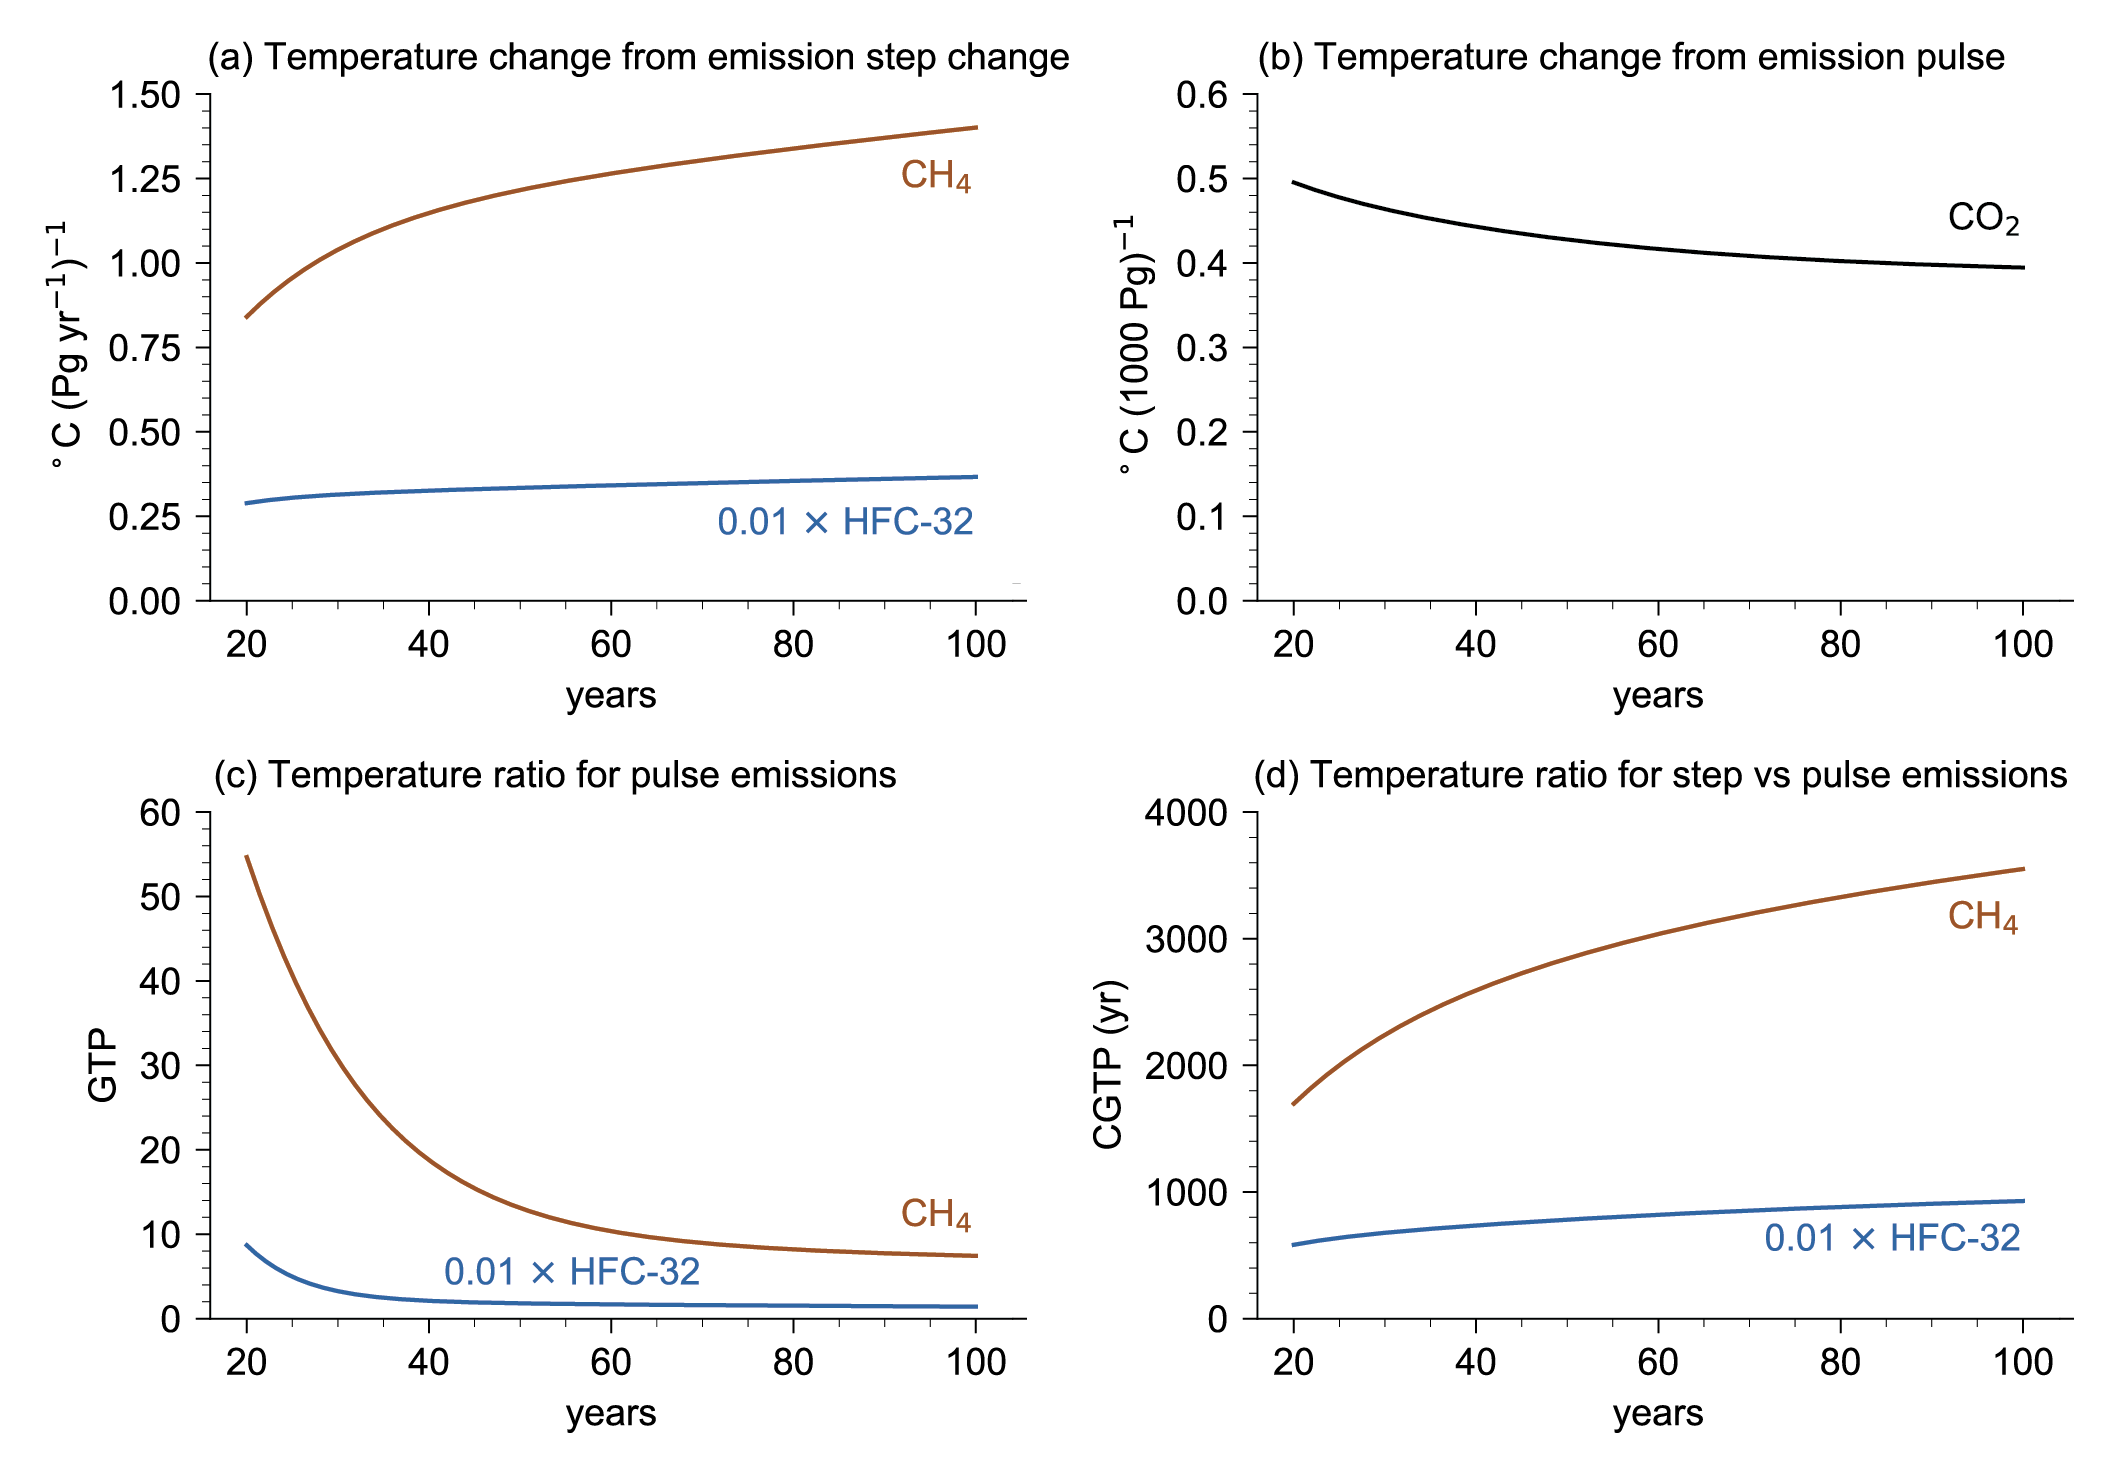
Figure caption
Figure 7.21 | Emissions metrics for two short-lived greenhouse gases: HFC-32 and methane (CH4; lifetimes of 5.4 and 11.8 years). The temperature response function comes from Supplementary Material 7.SM.5.2. Values for non-CO2 species include the carbon cycle response Section 7.6.1.3). Results for HFC-32 have been divided by 100 to show on the same scale. (a) Temperature response to a step change in short-lived greenhouse gas emissions. (b) Temperature response to a pulse CO2 emission. (c) Conventional GTP metrics (pulse vs pulse). (d) Combined GTP metric (step versus pulse). Further details on data sources and processing are available in the chapter data table (Table 7.SM.14).