Back chapter figures
Figure 7.22
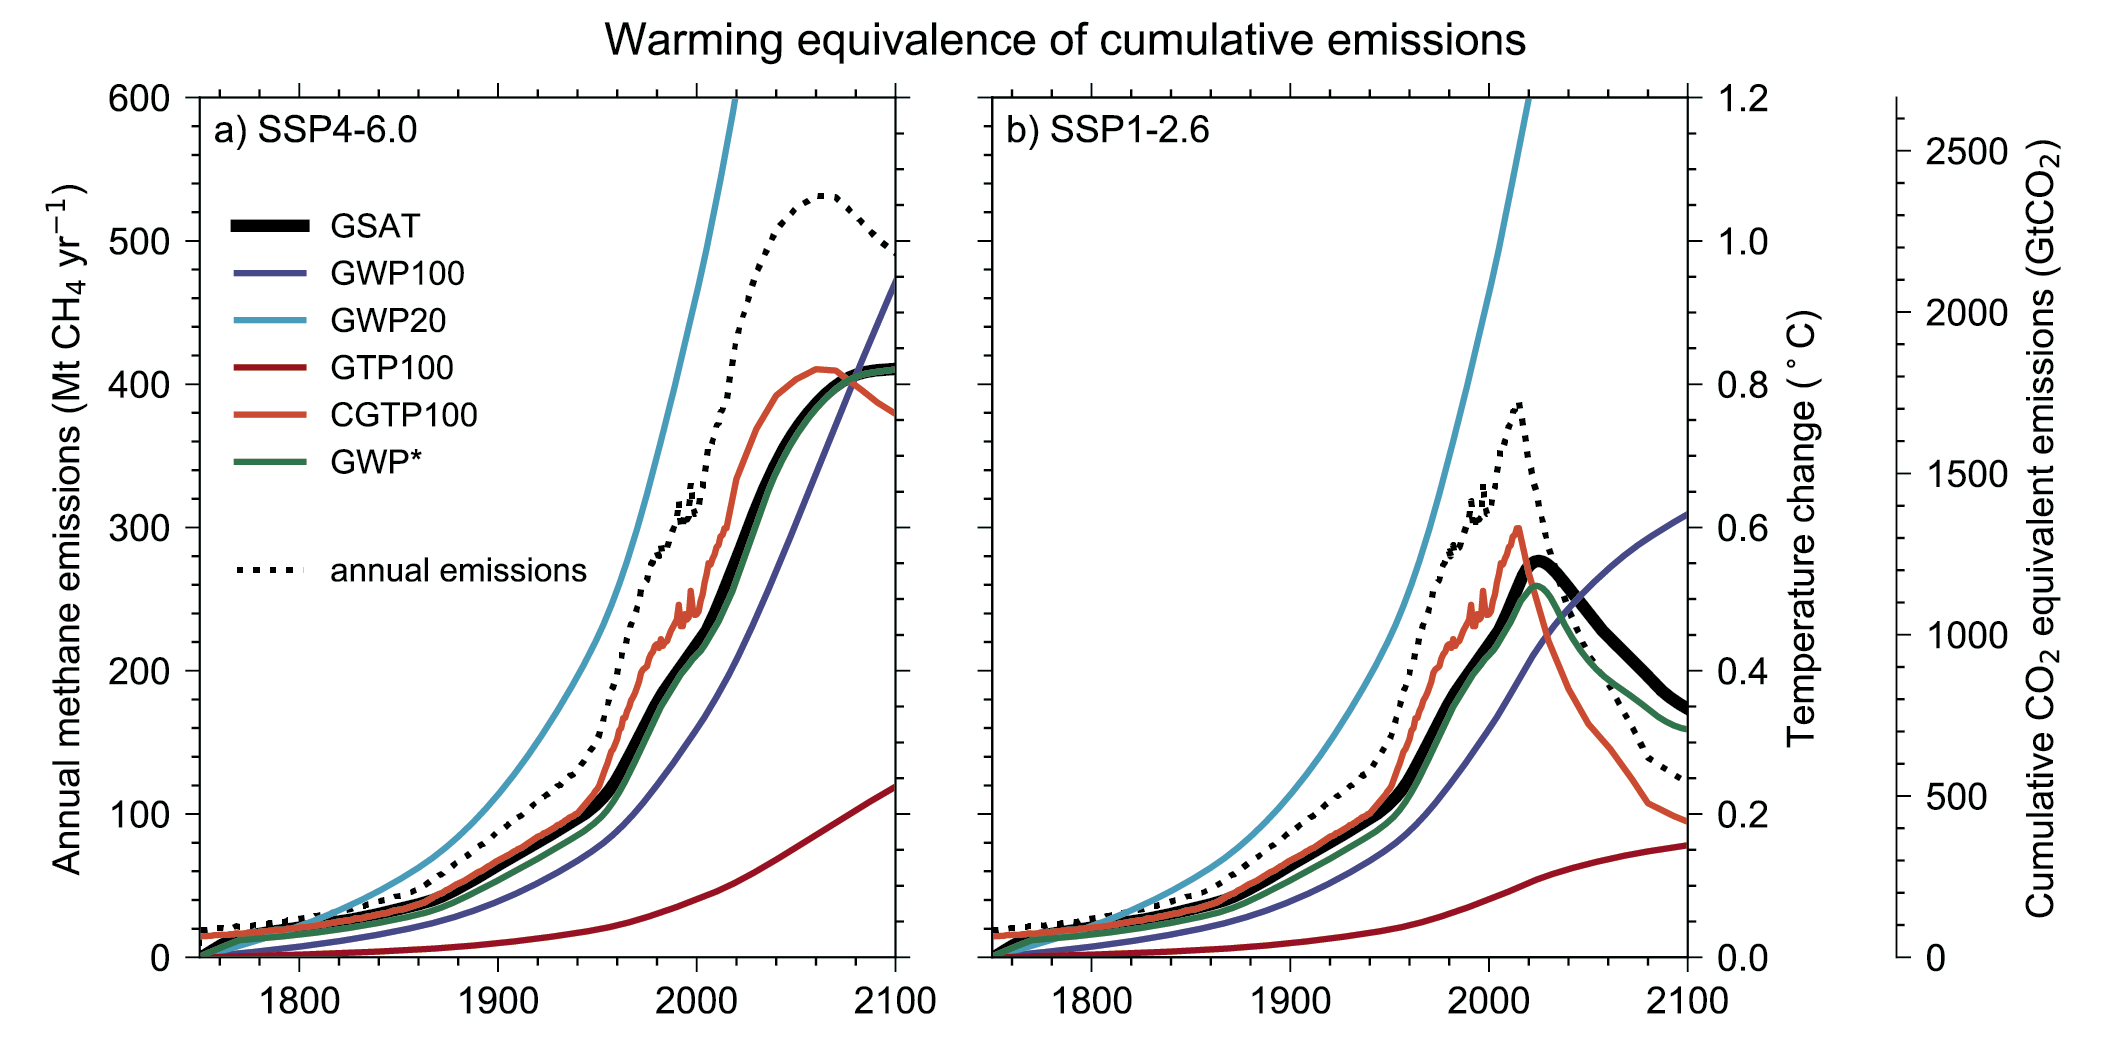
Figure caption
Figure 7.22 | Explores how cumulative carbon dioxide equivalent emissions estimated for methane vary under different emissions metric choices and how estimates of the global surface air temperature (GSAT) change deduced from these cumulative emissions compare to the actual temperature response computed with the two-layer emulator (solid black lines). Panels (a) and (b) show the SSP4-6.0 and SSP1-2.6 scenarios respectively. The panels show annual methane emissions as the dotted lines (left axis) from 1750 to 2100. The solid lines can be read as either estimates of GSAT change or estimates of the cumulative carbon dioxide equivalent emissions. This is because they are related by a constant factor, the TCRE. Thus, values can be read using either of the right-hand axes. Emissions metric values are taken from Table 7.15. The GWP* calculation is given in Section 7.6.1.4. The two-layer emulator has been calibrated to the central values of the Report’s assessment (see Supplementary Material 7.SM.5.2). Further details on data sources and processing are available in the chapter data table (Table 7.SM.14).